LOYOLA COLLEGE (AUTONOMOUS), CHENNAI – 600 034
advertisement

LOYOLA COLLEGE (AUTONOMOUS), CHENNAI – 600 034
B.Sc. DEGREE EXAMINATION – STATISTICS
FIFTH SEMESTER – APRIL 2012
ST 5507 - COMPUTATIONAL STATISTICS
Date : 03-05-2012
Time : 9:00 - 12:00
Dept. No.
Max. : 100 Marks
Answer any THREE of the following questions:
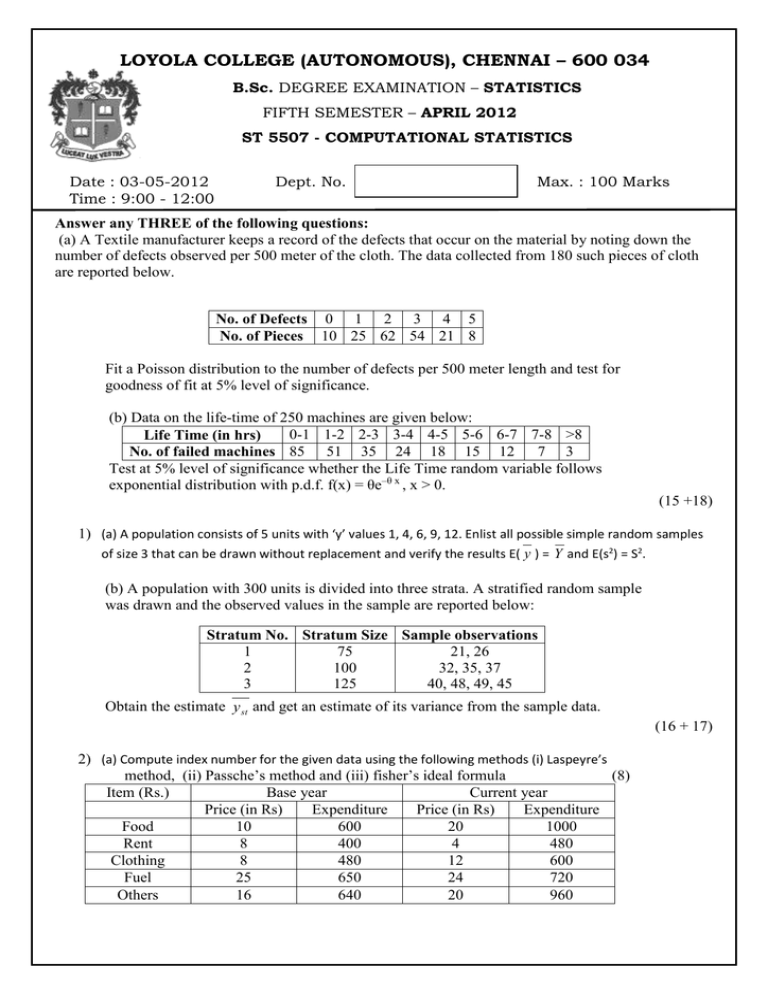
(a) A Textile manufacturer keeps a record of the defects that occur on the material by noting down the
number of defects observed per 500 meter of the cloth. The data collected from 180 such pieces of cloth
are reported below.
No. of Defects 0 1 2 3 4 5
No. of Pieces 10 25 62 54 21 8
Fit a Poisson distribution to the number of defects per 500 meter length and test for
goodness of fit at 5% level of significance.
(b) Data on the life-time of 250 machines are given below:
0-1 1-2 2-3 3-4 4-5 5-6 6-7 7-8 >8
Life Time (in hrs)
No. of failed machines 85 51 35 24 18 15 12 7 3
Test at 5% level of significance whether the Life Time random variable follows
exponential distribution with p.d.f. f(x) = θe–θ x , x > 0.
(15 +18)
1) (a) A population consists of 5 units with ‘y’ values 1, 4, 6, 9, 12. Enlist all possible simple random samples
of size 3 that can be drawn without replacement and verify the results E( y ) = Y and E(s2) = S2.
(b) A population with 300 units is divided into three strata. A stratified random sample
was drawn and the observed values in the sample are reported below:
Stratum No. Stratum Size Sample observations
1
75
21, 26
2
100
32, 35, 37
3
125
40, 48, 49, 45
Obtain the estimate y st and get an estimate of its variance from the sample data.
(16 + 17)
2) (a) Compute index number for the given data using the following methods (i) Laspeyre’s
method, (ii) Passche’s method and (iii) fisher’s ideal formula
(8)
Item (Rs.)
Base year
Current year
Price (in Rs)
Expenditure
Price (in Rs)
Expenditure
Food
10
600
20
1000
Rent
8
400
4
480
Clothing
8
480
12
600
Fuel
25
650
24
720
Others
16
640
20
960
(b) Change the base year 1996 to 2000 and rewrite the series of index numbers in the
following data:
Year
Index
2000
100
2001
112
2002
125
2003
160
2004
140
2005
165
2007
170
2008
175
2009
182
(5)
(c) Calculate the seasonal indices by the method of least squares from the following data:
(Multiplicative model)
(20)
Year
2001
2002
2003
2004
2005
I
71
76
74
76
78
Exports of cotton textiles (million Rs.)
II
III
65
79
66
82
68
84
70
84
72
86
3)
(a)
day at a
14 trucks are loaded with a particular product.
IV
71
75
80
79
85
On any given
warehouse,
It is claimed that the median weight m of each load of the product is 39,000 pounds.
On a particular day, the following observations were obtained:
41,195
39,485
38,345
34,930
41,229
36,840
39,245
31,031
38,050
40,780
40,890 35720
38,050
30,906
Test the null hypothesis H0 : m = 39,000 against the one-sided alternative hypothesis
H1 : m < 39,000 using the critical region C = { y | y ≥ 9 } where ‘y’ is the number of observations in the
sample that are less than 39,000. Find the significance level α for the critical region C. Also find the p –
value of this test.
(13)
(b) A vendor produces and sells low-fat milk powder to a company that
uses it to produce health drink formulae. In order to determine the fat
content of the milk powder , both the company and the vendor take a
sample from each lot and test it for fat content in percent. Ten sets of paired
test results are as follows:
Lot
Vendor
Number
test results( Y)
Company Test Results (X) Vendor Test Results (Y)
1
0.50
0.79
2
0.58
0.71
3
0.90
0.82
4
1.17
0.82
5
1.14
0.73
6
1.25
0.77
7
0.75
0.72
8
1.22
0.79
9
0.74
0.72
10
0.80
0.91
11
0.92
0.74
12
0.58
0.55
1
Test the hypothesis H0 : p = P[X > Y] = 2 against the one – sided alternative H1 : p >
using the critical region C = { w | w ≥ 7 }, where ‘w’ is the number of pairs for which
Xi – Yi > 0. Find the significance level α and p – value of this test.
(20)
4) (a) Measurements of the fat content of two kinds of food item , Brand X and Brand Y
yielded the sample data :
Brand X : 13.5
14.0 13.6 12.9 13.0 14.2 15.0 14.3 13.8
Brand Y : 12.9
13.0 12.8 143.5 12.7 15.0 18.7 11.8 14.3
Test the null hypothesis μ1 = μ2 against μ1 ≠ μ2 at 5% level of significance.
(9)
( b)
Two random samples drawn from two normal populations are :
Sample I : 23
15
25
27
23 20
18
24 25
Sample II : 27
33
45
35
32 35
33
28 41
43
Test whether the two populations have the same variances. Use 5% significance
level.
(8)
(c) Seven coins were tossed and the number of heads noted. The experiment was repeated
130 times and the following distribution was obtained.
No. of heads : 0
1
2
3
4
5
6
7
Frequency : 7
6
19
35
30
23
9
1
Fit a binomial distribution to the given data and test the goodness of fit at 1% level of
significance.
(16marks)
1
2
$$$$$$$


