LOYOLA COLLEGE (AUTONOMOUS), CHENNAI – 600 034
advertisement
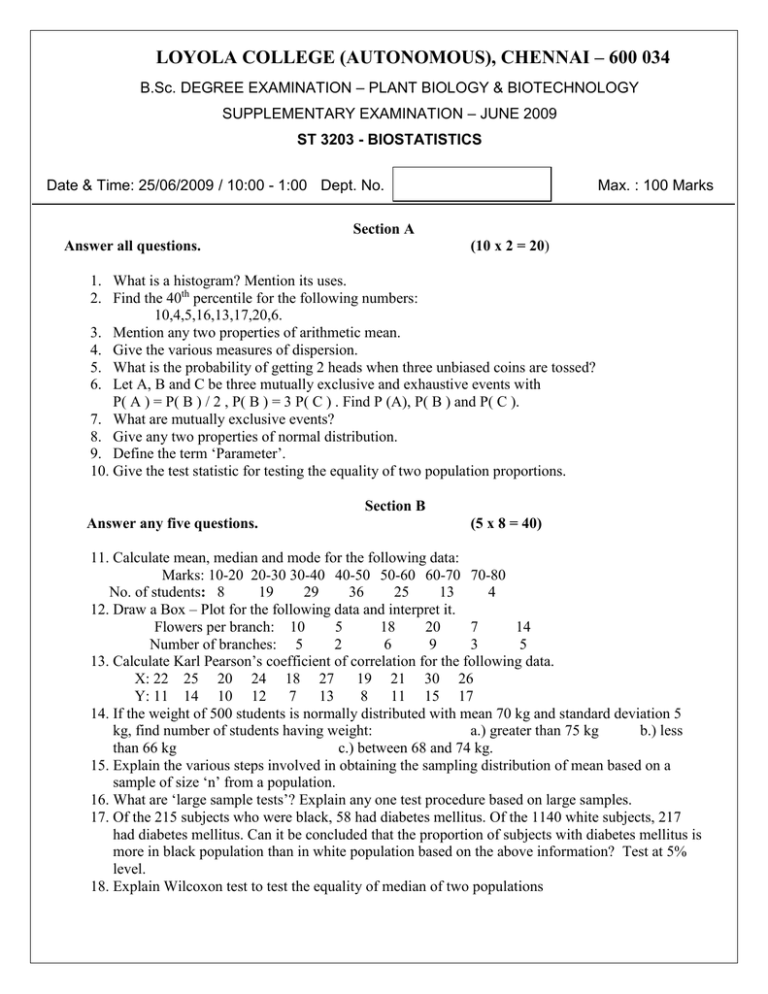
LOYOLA COLLEGE (AUTONOMOUS), CHENNAI – 600 034 B.Sc. DEGREE EXAMINATION – PLANT BIOLOGY & BIOTECHNOLOGY SUPPLEMENTARY EXAMINATION – JUNE 2009 ST 3203 - BIOSTATISTICS Date & Time: 25/06/2009 / 10:00 - 1:00 Dept. No. Max. : 100 Marks Section A Answer all questions. (10 x 2 = 20) 1. What is a histogram? Mention its uses. 2. Find the 40th percentile for the following numbers: 10,4,5,16,13,17,20,6. 3. Mention any two properties of arithmetic mean. 4. Give the various measures of dispersion. 5. What is the probability of getting 2 heads when three unbiased coins are tossed? 6. Let A, B and C be three mutually exclusive and exhaustive events with P( A ) = P( B ) / 2 , P( B ) = 3 P( C ) . Find P (A), P( B ) and P( C ). 7. What are mutually exclusive events? 8. Give any two properties of normal distribution. 9. Define the term ‘Parameter’. 10. Give the test statistic for testing the equality of two population proportions. Section B Answer any five questions. (5 x 8 = 40) 11. Calculate mean, median and mode for the following data: Marks: 10-20 20-30 30-40 40-50 50-60 60-70 70-80 No. of students: 8 19 29 36 25 13 4 12. Draw a Box – Plot for the following data and interpret it. Flowers per branch: 10 5 18 20 7 14 Number of branches: 5 2 6 9 3 5 13. Calculate Karl Pearson’s coefficient of correlation for the following data. X: 22 25 20 24 18 27 19 21 30 26 Y: 11 14 10 12 7 13 8 11 15 17 14. If the weight of 500 students is normally distributed with mean 70 kg and standard deviation 5 kg, find number of students having weight: a.) greater than 75 kg b.) less than 66 kg c.) between 68 and 74 kg. 15. Explain the various steps involved in obtaining the sampling distribution of mean based on a sample of size ‘n’ from a population. 16. What are ‘large sample tests’? Explain any one test procedure based on large samples. 17. Of the 215 subjects who were black, 58 had diabetes mellitus. Of the 1140 white subjects, 217 had diabetes mellitus. Can it be concluded that the proportion of subjects with diabetes mellitus is more in black population than in white population based on the above information? Test at 5% level. 18. Explain Wilcoxon test to test the equality of median of two populations Section C Answer any two questions. (2 x 20 = 40) 19. a.) Find the quartile deviation, standard deviation and their coefficients from the following data: X: 10 14 17 20 24 f: 5 3 12 18 12 b.) Assume that a factory has two machines. Past records show that machine 1 produces 30% of the items of the output and machine 2 produces 70% of the items. Further 5% of the items produced by machine 1 were defective and only 1% produced by machine 2 were defective. If a defective item is drawn at random, what is the probability that it was produced by a.) machine 1 b.) machine 2 ? (12+8) 20. a.) Fit a binomial distribution to the following data. X: 0 1 2 3 4 f: 5 7 10 8 3 b.) Fit a regression line of Y on X based on the following data. Y: 94 88 120 132 145 124 82 94 104 112 X: 28 21 34 37 27 46 18 30 41 56 . (10+10) 21. a.) The following data present the yields in quintals of wheat taken randomly from two agricultural plots of equal area. Plot 1: 6.2 5.7 6.5 6.0 6.3 5.8 5.7 6.0 6.0 5.8 Plot 2: 5.6 5.9 5.6 5.7 5.8 5.7 6.0 5.5 5.7 5.5 Test at 5% level whether the mean yield of wheat in the two agricultural plots are equal. Assume that the population variances are equal. b.) Explain the Chi square test for testing the independence of attributes. (12+8) 22.) The following data gives the yield of a crop obtained by applying three different fertilizers in four blocks. Fertilizer A B C I 24.7 20.6 27.7 II 27.3 28.8 22.9 Block III 38.5 39.5 36.8 IV 28.5 31.0 34.9 Perform a two way analysis of variance by clearly stating the hypotheses. Use 5% level of significance. *****************
