LOYOLA COLLEGE (AUTONOMOUS), CHENNAI – 600 034
advertisement

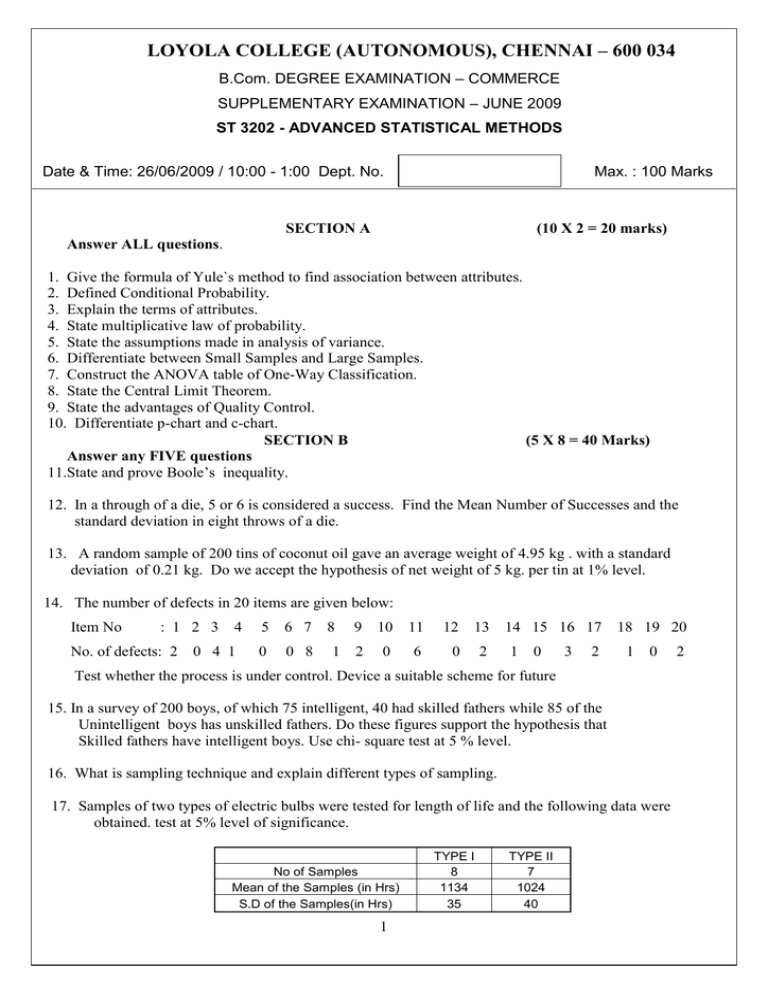
LOYOLA COLLEGE (AUTONOMOUS), CHENNAI – 600 034 B.Com. DEGREE EXAMINATION – COMMERCE SUPPLEMENTARY EXAMINATION – JUNE 2009 ST 3202 - ADVANCED STATISTICAL METHODS Date & Time: 26/06/2009 / 10:00 - 1:00 Dept. No. Max. : 100 Marks SECTION A (10 X 2 = 20 marks) Answer ALL questions. 1. Give the formula of Yule`s method to find association between attributes. 2. Defined Conditional Probability. 3. Explain the terms of attributes. 4. State multiplicative law of probability. 5. State the assumptions made in analysis of variance. 6. Differentiate between Small Samples and Large Samples. 7. Construct the ANOVA table of One-Way Classification. 8. State the Central Limit Theorem. 9. State the advantages of Quality Control. 10. Differentiate p-chart and c-chart. SECTION B (5 X 8 = 40 Marks) Answer any FIVE questions 11.State and prove Boole’s inequality. 12. In a through of a die, 5 or 6 is considered a success. Find the Mean Number of Successes and the standard deviation in eight throws of a die. 13. A random sample of 200 tins of coconut oil gave an average weight of 4.95 kg . with a standard deviation of 0.21 kg. Do we accept the hypothesis of net weight of 5 kg. per tin at 1% level. 14. The number of defects in 20 items are given below: Item No : 1 2 3 No. of defects: 2 4 0 4 1 5 6 7 0 0 8 8 1 9 10 11 12 13 2 0 6 0 2 14 15 16 17 1 0 3 2 18 19 20 1 0 Test whether the process is under control. Device a suitable scheme for future 15. In a survey of 200 boys, of which 75 intelligent, 40 had skilled fathers while 85 of the Unintelligent boys has unskilled fathers. Do these figures support the hypothesis that Skilled fathers have intelligent boys. Use chi- square test at 5 % level. 16. What is sampling technique and explain different types of sampling. 17. Samples of two types of electric bulbs were tested for length of life and the following data were obtained. test at 5% level of significance. No of Samples Mean of the Samples (in Hrs) S.D of the Samples(in Hrs) 1 TYPE I 8 1134 35 TYPE II 7 1024 40 2 18. Given, the following table calculate the frequencies of the remaining classes (A) = 100, (AB) = 60, (B) = 80, N = 200. SECTION C (2 X 20 = 40 Marks) Answer any TWO questions 19. (a) A number of school children were examined for the presence or absence certain defects of which three Chief descriptions were noted; A development defects; B nerve signs; C low nutrition. Given the following ultimate frequencies. Find the frequencies of the classes defined by the Presence of the defects. (ABC) = 57; (αBC) = 78; (AB) = 281; (α) = 670; (AC) = 86; (αC) = 65; (A) = 453; (α) = 8310; (b) State and prove Baye`s Theorem. ( 12 + 8 ) 20. (a) There are 3 boxes containing respectively 1 White,2 Red, 3 block; 2 white,3 red, 1 black ball; 3 white , 1 red and 2 black ball. A box is chosen at random and from it two balls are drawn At random. The two balls are 1 red and 1 white. What is the probability that they come from (i) The first box (ii) second box (iii) third box. 20.(b) The customer accounts of a certain department store have an average balance of Rs.120 and a SD of Rs.40. Assuming that the account balance are normally distributed (i) what proportion of account is over Rs.150? (ii) what proportion of account is between Rs.100 and Rs.150? (iii) what proportion of accounts is between Rs.60 and Rs.90? 21. ( 10 + 10 ) Prepare two – way ANOVA for the data given below. Treatment A B C D I 38 40 41 39 II 45 42 49 36 III 40 38 42 42 Plots of Land 22. (a) Random Samples of 400 Men and 600 Women were asked whether they would like to have a fly- over near their residence. 200 men and 325 women were in favor of it. Test the equality of proportion of men and women in the proposal. (b) The following table gives the number of defective items found in 20 successive samples of 100 items each. 2 6 2 4 4 15 0 4 10 18 2 4 6 4 8 0 2 2 4 0 Comment whether the process is under control. Suggest suitable control limits for the future ( 10 + 10 ) *************** 2


