LOYOLA COLLEGE (AUTONOMOUS), CHENNAI – 600 034
advertisement
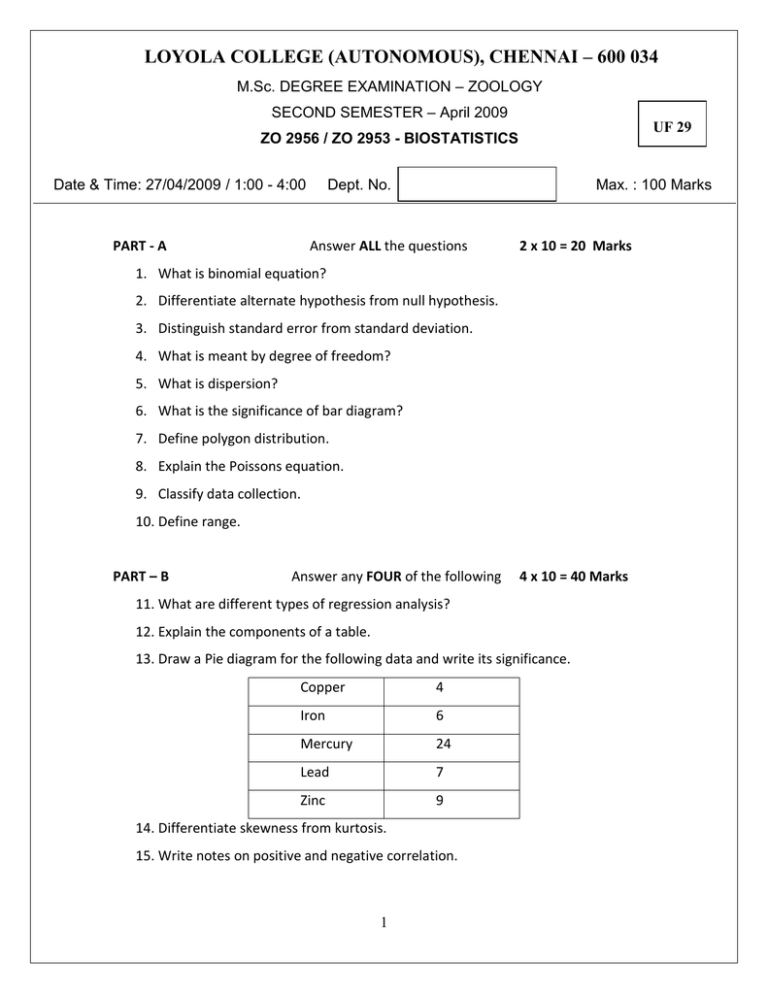
LOYOLA COLLEGE (AUTONOMOUS), CHENNAI – 600 034 M.Sc. DEGREE EXAMINATION – ZOOLOGY SECOND SEMESTER – April 2009 UF 29 ZO 2956 / ZO 2953 - BIOSTATISTICS Date & Time: 27/04/2009 / 1:00 - 4:00 PART - A Dept. No. Max. : 100 Marks Answer ALL the questions 2 x 10 = 20 Marks 1. What is binomial equation? 2. Differentiate alternate hypothesis from null hypothesis. 3. Distinguish standard error from standard deviation. 4. What is meant by degree of freedom? 5. What is dispersion? 6. What is the significance of bar diagram? 7. Define polygon distribution. 8. Explain the Poissons equation. 9. Classify data collection. 10. Define range. PART – B Answer any FOUR of the following 4 x 10 = 40 Marks 11. What are different types of regression analysis? 12. Explain the components of a table. 13. Draw a Pie diagram for the following data and write its significance. Copper 4 Iron 6 Mercury 24 Lead 7 Zinc 9 14. Differentiate skewness from kurtosis. 15. Write notes on positive and negative correlation. 1 16. Calculate the chi square for the following data and find if there is any significance between RBC and Hb (Table value = 3.84). RBC Count Below Hb Below Hb Above Normal Normal 80 120 160 130 Normal Above Normal PART – C Answer any TWO of the following 2 x 20 = 40 Marks 17. The following table shows the effectiveness of antibiotics X in killing bacteria Y. Apply regression equation X on Y. Calculate when Y=4, 7 Antibiotics (X) 12 14 15 17 19 Bacteria (Y) 5 6 9 11 12 18. Describe different graphical and diagramatic representation of data, with suitable examples. 19. Draw histogram, polygon and cumulative frequency for the following data. Wt (gm) 1.1-3.0 3.1-6.0 6.1-9.0 9.1-12.0 12.1-15 11 13 22 21 5 Frequency 15.1-18 20. By ANOVA find if there is an increase in wheat production in different sub species in different plots A, B, C and D (Table value = 3.49). A B C D 5 4 6 9 12 6 3 7 11 10 9 5 4 3 1 8 ********** 2 5
