Hurricane Evacuation Study Results
advertisement
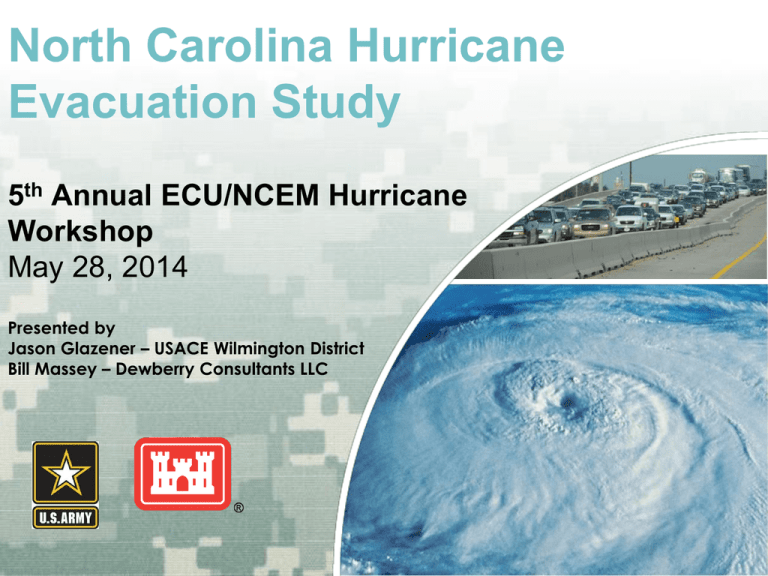
North Carolina Hurricane Evacuation Study 5th Annual ECU/NCEM Hurricane Workshop May 28, 2014 Presented by Jason Glazener – USACE Wilmington District Bill Massey – Dewberry Consultants LLC US Army Corps of Engineers BUILDING STRONG® Hurricane Evacuation Studies (HES) Goal: To provide emergency management officials sound data that will inform them in hurricane evacuation planning and decision-making BUILDING STRONG 2 ® 1-2 2 3-5 • • • • Identify at risk populations infrastructure critical facilities • Local Planning data Transportation Analysis 100% 90% 80% 70% 60% 50% 40% 30% 20% 10% 0% Vulnerability Analysis • Surge Maps • Evacuation Zones • Public Survey • Analysis of Survey responses • results for input into shelter and trans analysis Percentage of Responses • SLOSH Model development • Surge MOMS Behavioral Analysis Hazards Analysis Hurricane Evacuation Studies (HES) • Analysis of traffic volumes, evac routes, and destinations • Traffic patterns • Evacuation Clearance Times Shadow Evacuation Zone A Overall With Order BUILDING STRONG® Project Team- North Carolina HES USACE ► Jason Glazener, Allan McDuffie- USACE Study Managers FEMA ► Brandon Bolinski, Hurricane Program Manager-FEMA Region IV NOAA/NHC ► Jamie Rhome, Chief, Storm Surge Branch-National Hurricane Center NCEM ► Corey Johnson, Hurricane Program Manager- NCEM COASTAL COUNTIES ► County EM Coordinators DEWBERRY CONSULTANTS LLC ► Bill Massey BUILDING STRONG® North Carolina Hurricane Evacuation Study Update NC HES Update Overview NC Hazards Analysis NC Behavioral Analysis NC Vulnerability Analysis NC Transportation Analysis Interactive Technical Data Report BUILDING STRONG® Proposed Study Schedule Hazards Analysis- Completed Behavioral Analysis- Completed Vulnerability Analysis- Proposed Start- June, 2014 Transportation Analysis- Proposed Start- December 2014 Interactive Technical Data Report- December 2015 BUILDING STRONG® Overview of Scope of Work Task 1: Hazards Analysis New SLOSH Models for North Carolina ► Hatteras Basin ► Wilmington Basin ► New Storm Surge Maps for 30 Counties BUILDING STRONG® Carteret County Surge Areas BUILDING STRONG® Dare County Storm Surge Areas BUILDING STRONG® New Hanover County Surge Areas BUILDING STRONG® Pender County Surge Areas BUILDING STRONG® Brunswick County Surge Areas BUILDING STRONG® Hyde County Surge Areas BUILDING STRONG® Pitt County Surge Areas BUILDING STRONG® Overview of Scope of Work Task 2: Coordination Process: ► Conduct and document kickoff and final meetings ► Initiate and maintain coordination with stakeholders BUILDING STRONG® Task 3-Behavioral Analysis BUILDING STRONG® North Carolina Hurricane Evacuation Behavioral Analysis Results presented to NCEM in January, 2014 CONDUCTED BY: HAZARDS MANAGEMENT GROUP, INC. BUILDING STRONG® Sample Allocation East Southeast Islands 200 200 Cat 1-2 200 200 Cat 3-5 200 200 Non-surge 150 150 BUILDING STRONG® Behavioral Questionnaire Topics Perceived Vulnerability Housing Characteristics Expectation of Evacuation Notices Intentions to Evacuate Reasons for Leaving Reasons for Staying Obstacles to Evacuation Evacuation Planning Access to Information Military Influence Vehicle Use Intended Refuge Location of Refuge Routes to be Used Expected Duration of Stay in Refuge Response in Irene Response in Earl Demographics BUILDING STRONG® Task 4- Vulnerability Analysis BUILDING STRONG® Vulnerability Analysis The purpose of this vulnerability analysis is to identify the areas, populations, and facilities that are potentially vulnerable to hurricane-induced flooding and wind for the 5 hurricane categories. The inundation maps (storm hazards atlas) produced by the USACE for the Hazards Analysis will be used to determine which surge vulnerable areas may need to be evacuated in response to a particular coastal storm threat. The vulnerable population data of those residing in these areas will be taken from the Transportation Analysis. BUILDING STRONG® Vulnerability Analysis Process ► Contact all State and county offices that may have such data ► Compile a county wide GIS data set for All Coastal Counties ► Determine which facilities could be impacted by the 5 MOM hurricane categories. ► Display data in GIS format showing each facility or point of interest with all pertinent data contained in the database ► Show the surge area and evacuation zone for each ► Show relationship to the 100 year floodplain ► Determine if the facility could be impacted by waves. BUILDING STRONG® Vulnerability Analysis Vulnerable Population Calculation ► Each Hurricane Storm Surge areas (5 SS Categories) • Population from Latest Census or State Data Base • Tourist Population BUILDING STRONG® Vulnerability Analysis Vulnerable Structures Calculation ► Each Hurricane Storm Surge areas (5 SS Categories) • TYPE: Residential Commercial Industrial • Mobile homes, permanent, tourist, etc. BUILDING STRONG® Vulnerability Analysis Vulnerable Critical Facilities Assessment ► ► State and locally defined facilities Database development • • • • • • • Name Lat/Long Facility type Storm surge category Evacuation zone Flood zone Wave Impact BUILDING STRONG® Task 5-Transportation Analysis BUILDING STRONG® Transportation Analysis Study components: Demographic and Behavioral Data Identify Evacuation Roadway Network Develop Evacuation Zones Traffic Modelling Generate Evacuation Statistics Distribute Evacuation Trips Identify Evacuating Vehicles by Roadway Segment Calculate Clearance Times By storm scenario Slow, medium, fast response rates Contraflow benefits BUILDING STRONG® ITDR U.S. Army Corps Of Engineers ® Wilmington District Task 6: Interactive Technical Data Report (ITDR) Process: ► Prepare a report describing methodologies, data and sources of data, calculations, assumptions, coordination and degree of accuracy of the vulnerability estimates and any other data pertinent to this effort. BUILDING STRONG® ITDR • Dewberry will prepare all vulnerability data and maps in a GIS format easily viewed by local and State emergency managers • Dewberry will determine what surge area it is in, what evacuation zone it is in, if it is in a 100 year floodplain and if it could be impacted by waves. BUILDING STRONG® ITDR The ITDR will include a GeoPDF ► Adobe File with GIS-Like Attributes Benefits— ► Complex geospatial data can be easily distributed in the common PDF format just about anyone can access and use. ► Utilizes tools people already have and are comfortable using (Adobe Reader) ► Collaboration on data and updates from remote users are enabled so that everyone can share data and work with the most accurate geospatial information ► EMAs spend less time making maps and interpreting them for others and more time on higher value initiatives ► EMAs can fulfill more data requests with less support while distributing maps that are more graphical and user-friendly BUILDING STRONG® North Carolina Hurricane Evacuation Study Thank you for your attention. Do you have any questions? BUILDING STRONG®
