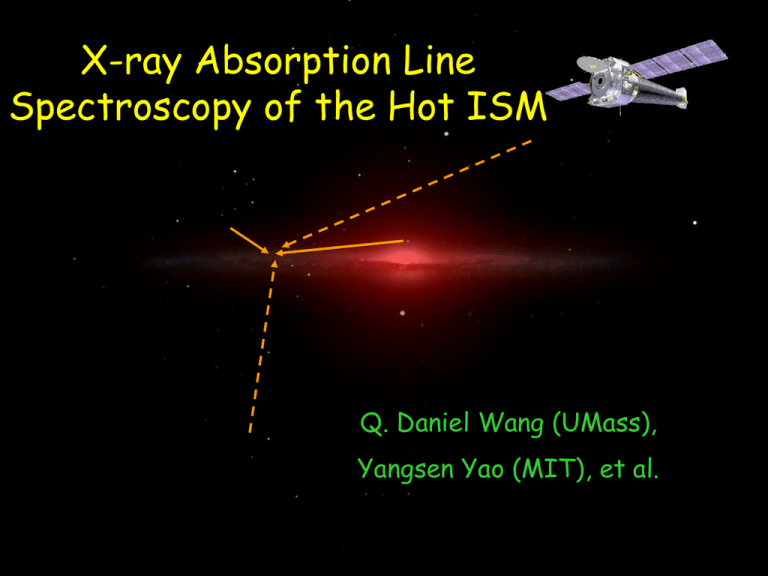
X-ray Absorption Line Spectroscopy of the Hot ISM Q. Daniel Wang (UMass),
advertisement

X-ray Absorption Line Spectroscopy of the Hot ISM Q. Daniel Wang (UMass), Yangsen Yao (MIT), et al. Why X-ray absorption lines? • Tracing all K transitions of metals all three phases of the ISM. • Not affected by photoelectric absorption unbiased measurements of the global ISM. LETG+HETG spectrum of LMXB X1820-303 Yao & Wang 2006, Yao et al. 2006, Futamoto et al 2004 Fe XVII K Spectroscopic diagnostics OVII OVII Ne IXI Ne VIII OVI Ne X Assuming solar abundances and CIE One line (e.g., OVII K) velocity centroid and EW constraints on the column density, depending on assumed b and T Two lines of different ionization states (OVII and OVIII K) T Two lines of the same state (K and K) b Lines from different species abundance fa Absline: an XSPEC-based joint-fit routine • Allow fits to individual spectral lines as well as broad-band spectra • Accounting for line saturation: I()=Ic() exp[-()] ()NHfafi(T)flu(,0,b) b=(2kT/mi+2)1/2 • Allow for measurements of thermal, chemical, and kinetic properties of the hot ISM. • Rigorous error estimates of all parameters. Yao & Wang 2005 Add velocity and/or depth X-ray binary AGN X-ray binary ROSAT all-sky survey in the ¾-keV band Comparison of the emission and absorption data • From emission data (McCammon et al. 2002) – ~50% of the background intensity is thermal and local (z < 0.01) – Measurement of emission measure • X-ray absorption line spectroscopy – Measure the column density, thus the mass The combination of the emission/absorption data physical scale of the hot gas Mkn 421 LETG/HRC LETG/ACIS PKS 2155 3C 273 Z~0 absorption: Evidence for the warm-hot IGM? • Suggested initially based on 1-T modeling • But demands a too large total baryon mass (Fang et al. 2006) • No enhancement observed through the inner region of the local group (Bregman et al, 2007) • No detection through other groups of galaxies Mrk 421: Joint absorption/emission line analysis •1-T model is inconsistent with the OVIII and OVII K emission line ratio (McCammon et al. 2002). •The absorption and emission lines are consistent with the model: n=n0e-z/hn; T=T0e-z/hT n=n0(T/T0), =hT/hn, L=hn/sin b (d)-(f) include the far-UV OVI absorption line (Yao & Wang 2006) Properties of the hot gas towards Mkn 421 • Not isothermal • Consistent with a exponential hot disk model with T0 = 2.8 x 10⁶ K and n0=2.4 x 10⁻³ cm-3 and hn~ 2 kpc, which is comparable to the scale height of OVI-absorbing gas (2.3 kpc; Savage et al. 2003) • This thick hot disk most likely represents the Galactic corona, heated and enriched by supernovae in the Galactic disk. Differential absorption analysis 3C 273 Mkn 421 Assuming a 1-T thermal plasma of solar abundances: NH ~ 2.2 x 1019 cm-2 T ~ 2.0 x 10⁶ K vb ~ 2x10² km/s Yao & Wang 2007 Joint-fit with the emission enhancement 3C 273 Mkn 421 ROSAT PSCP ¾-keV band • Scale = 2.4 (1-10) kpc (90% interval) • Indicating primarily Galactic bulge/center origin • Total thermal energy ~ 1056 ergs, consistent with estimate from dynamic modeling (Sofue 2000; BlankHawthorn & Cohen 2003) LMC X-3 as a distance marker • BH X-ray binary, typically in a high/soft state • Roche lobe accretion • 50 kpc away • Vs = +310 km/s • Away from the LMC main body H image Wang et al. 2005 LMC X-3: absorption lines •The line centroid of the OVI and OVII lines are consistent with the Galactic origin. •No~1.9 x 10¹⁶ atoms/cm2, similar to those seen in AGN spectra! •T ~ 1.3 x 10⁶ K •vb ~ 79 km/s Joint-fit to the Suzaku XIS diffuse emission spectrum • 100 ks • 0.5 deg off LMC X-3 • Assuming the thick hot disk model LMXB X1820-303 • In GC NGC 6624 – l, b = 2o.8, -8o – Distance = 7.6 kpc tracing the global ISM – 1 kpc away from the Galactic plane NHI • Two radio pulsars in the GC: DM Ne • Chandra observations: – 15 ks LETG (Futamoto et al. 2004) – 21 ks HETG LETG+HETG spectrum Yao & Wang 2006, Yao et al. 2006 Fe XVII K X1820-303: Results • Hot gas accounts for ~ 6% of the total O column density • Mean temperature T = 106.34 K • O abundance: – 0.3 (0.2-0.6) solar in neutral atomic gas – 2.0 (0.8-3.6) solar in ionized gas • Hot Ne/O =1.4(0.9-2.1) solar (90% confidence) • Hot Fe/Ne = 0.9(0.4-2.0) solar • Velocity dispersion 255 (165–369) km/s Exponential distribution models Disk model •nH = 5.0(-1.8,+2.6)x10-3 cm-3 exp[-|z|/1.1(-0.5,+0.7) kpc] •Total NH~1.6 x1019 cm-2 Sphere model •nH = 6.1(-3.0,+3.6)x10-2 cm-3 exp[-R/2.7(-0.4,+0.8) kpc] ~3 x 10⁻³ cm-3 at the Sun •Total NH~6.1 x1019 cm-2 X-ray absorption is primarily around •MH~7.5(2.5-16)x108 Msun the Galactic disk within a few kpc! Yao & Wang (2005) Global hot gas properties • Spatial extent: – Locally, the data are consistent with a thick Galactic disk with a density scale height ~2 kpc, ~ the values of OVI absorbers and free electrons – Much more extended around the Galactic bulge • Thermal structure: mean T ~ 106.3 K toward the inner region, ~ 106.1 K at solar neighborhood, but nonisothermal even locally. • Velocity dispersion: ~200 km/s in the inner region, 80 km/s in the solar neighborhood • O and Ne abundances: consistent with solar abundance ratios NGC 3556 (Sc) •Active star forming •Hot gas scale height ~ 2 kpc •Lx ~ 1% of SN energy Red – optical Green – 0.3-1.5 keV band Blue – 1.5-7 keV band Wang et al. 2004 NGC 4565 (Sb) Wang (2006) Red – optical Green – 0.3-1.5 keV band Blue – 1.5-7 keV band Very low specific SFR William McLaughlin (ARGO Cooperative Observatory) No sign for any outflows from the disk in radio and optical Conclusions • X-ray absorption line spectroscopy has led to the firm detection of the global hot ISM. • The spectroscopy allows for the study of the thermal, chemical and kinetic properties of the hot ISM. • The detected hot gas is strongly concentrated toward Galactic disk and bulge. • Heating is most due to SNe. But the bulk of their energy is not detected and is probably propagated into the halo, balancing the cooling. • But so far there is little X-ray evidence for a hot halo on scale ~ 100 kpc. NGC 2841 (Sb) • D=15 Mpc • Lx ~ 7 x 1039 ergs/s Red: optical Blue: 0.3-1.5 keV diffuse emission Wang 2006


