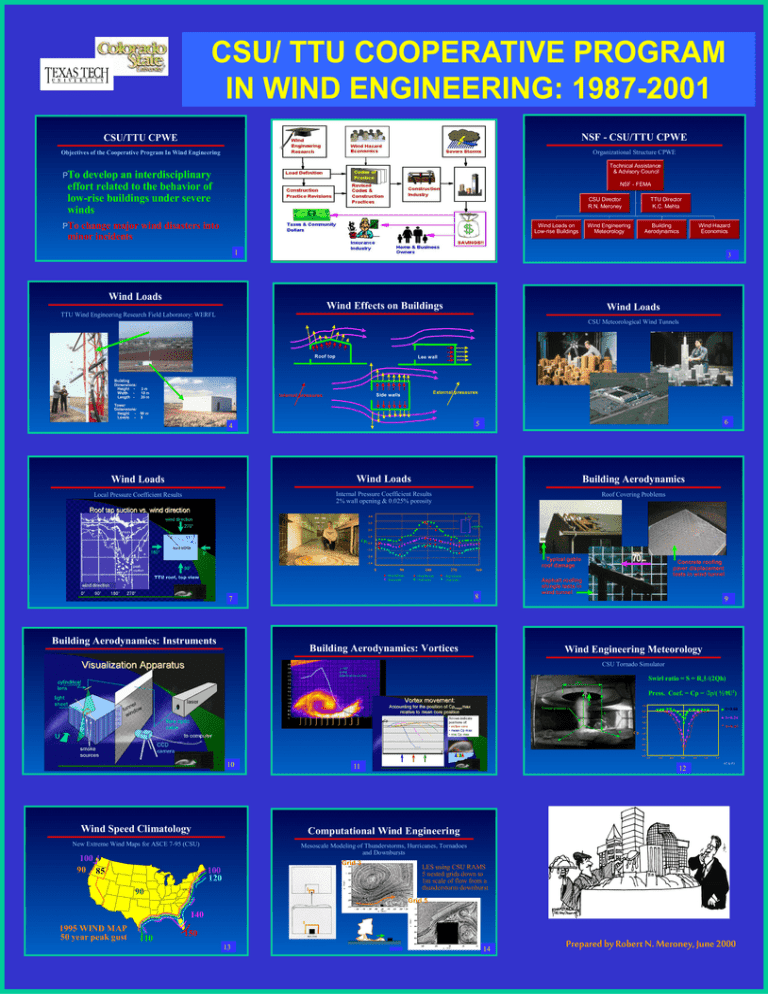
POSTER: CSU/TTU Cooperative Program in Wind Engineering (.ppt)
advertisement

CSU/ TTU COOPERATIVE PROGRAM IN WIND ENGINEERING: 1987-2001 CSU/TTU CPWE NSF - CSU/TTU CPWE Objectives of the Cooperative Program In Wind Engineering Organizational Structure CPWE Technical Assistance & Advisory Council PTo develop an interdisciplinary effort related to the behavior of low-rise buildings under severe winds NSF - FEMA CSU Director R.N. Meroney PTo change major wind disasters into minor incidents Wind Loads on Low-rise Buildings TTU Director K.C. Mehta Wind Engineering Meteorology Building Aerodynamics Wind Hazard Economics 1 F1 3 Wind Loads Wind Effects on Buildings Wind Loads TTU Wind Engineering Research Field Laboratory: WERFL CSU Meteorological Wind Tunnels Roof top Building Dimensions: Height Width Length - 3m 10 m 20 m Lee wall External pressures Side walls Internal pressures Tower Dimensions: Height - 50 m Levels - 8 F1 6 F1 5 4 F1 Wind Loads Wind Loads Building Aerodynamics Local Pressure Coefficient Results Internal Pressure Coefficient Results 2% wall opening & 0.025% porosity Roof Covering Problems 0o 4.0 3.0 µ=0.025 % 2.0 2% 1.0 Cpi 0.0 -1.0 -2.0 Typical gable roof damage -3.0 0 90 180 270 Mean full scale + Pe ak full scale - Peak full scale Mean model + Pe ak model - Peak model 360 Asphalt roofing shingle tests in wind tunnel 8 F1 F1 7 Building Aerodynamics: Instruments Concrete roofing paver displacement tests in wind tunnel 3T & F1 9 Building Aerodynamics: Vortices Wind Engineering Meteorology CSU Tornado Simulator Swirl ratio = S = Ro /(2Qh) 2 Ro Press. Coef. = Cp = p/( ½U2) Z Q 1.0 Lowest pressure S=0.08 0.0 h -1.0 S=0.24 -2.0 S=0.4 0 -3.0 R Cp -4.0 -5.0 -6.0 -7.0 -8.0 10 F1 -0.5 0.0 0.5 1 .0 1.5 4T & F1 12 Computational Wind Engineering New Extreme Wind Maps for ASCE 7-95 (CSU) Mesoscale Modeling of Thunderstorms, Hurricanes, Tornadoes and Downbursts Grid 3 LES using CSU RAMS 5 nested grids down to 1m scale of flow from a thunderstorm downburst 100 120 3 90 -1.0 R/Ro 1T & F1 11 Wind Speed Climatology 100 90 85 -1.5 Grid 5 140 5 1995 WIND MAP 50 year peak gust 110 150 F1 13 2T & F1 14 Prepared by Robert N. Meroney, June 2000


