Math 137 Module 12 Review Homework.docx
advertisement

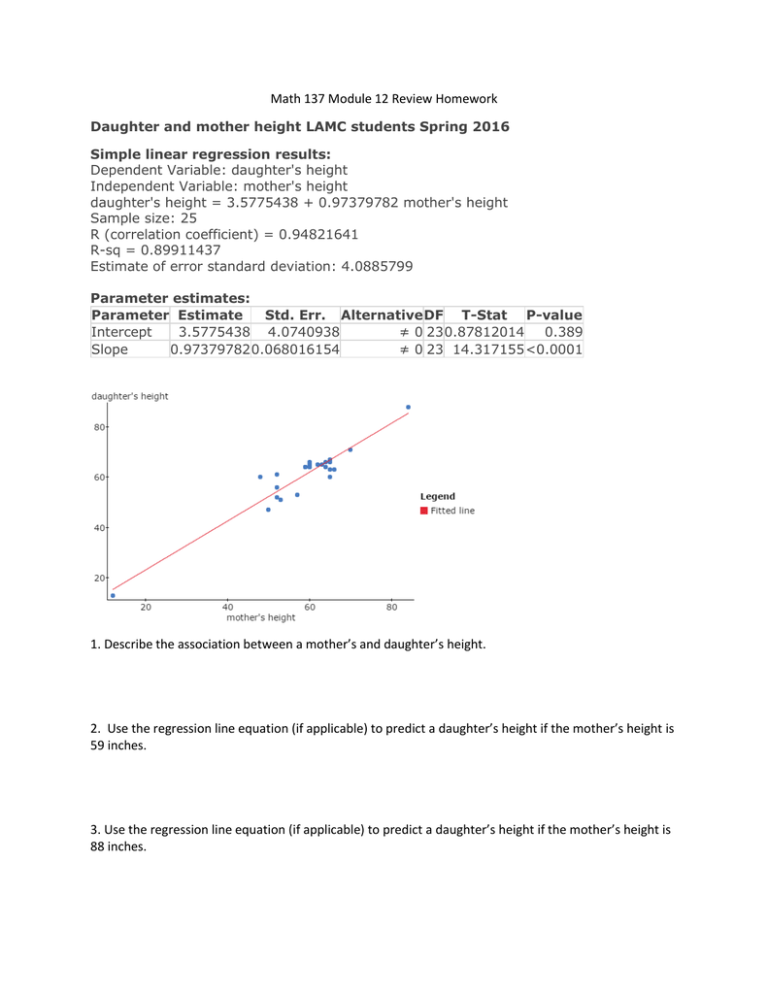
Math 137 Module 12 Review Homework Daughter and mother height LAMC students Spring 2016 Simple linear regression results: Dependent Variable: daughter's height Independent Variable: mother's height daughter's height = 3.5775438 + 0.97379782 mother's height Sample size: 25 R (correlation coefficient) = 0.94821641 R-sq = 0.89911437 Estimate of error standard deviation: 4.0885799 Parameter estimates: Parameter Estimate Std. Err. Alternative DF T-Stat P-value Intercept 3.5775438 4.0740938 ≠ 0 23 0.87812014 0.389 Slope 0.97379782 0.068016154 ≠ 0 23 14.317155 <0.0001 1. Describe the association between a mother’s and daughter’s height. 2. Use the regression line equation (if applicable) to predict a daughter’s height if the mother’s height is 59 inches. 3. Use the regression line equation (if applicable) to predict a daughter’s height if the mother’s height is 88 inches. 4. What is the slope of the regression line? What does the slope mean in this context? (Hint: No need to compute.) 5. What is the y-intercept of the regression line? What does the y-intercept mean in this context? (No need to compute). Does it have meaning in this case? The following statistics for this scatterplot were found to be: r=0.948 r 2 0.899 6. Given the scatterplot and these statistics, how well does the regression line fit this data? How confident could one be in making predictions with the regression line? (Use the value of r to support your answer.) 7. Explain the meaning in context of r 2 0.8855 with respect to this problem. 8. Are there any outliers? If so, state the ordered pairs that are outliers.


