2a. Representations of Earth II
advertisement

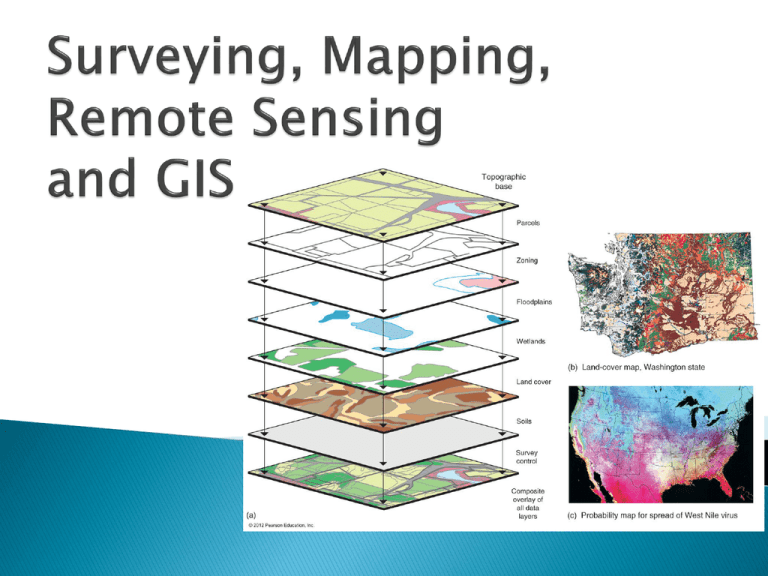
Maps – Communicate spatial data/information through “graphic symbols” – a language of location Cartography – the art and science of mapmaking – increasingly an automated, computerized process Mapmaking process involves a number of interlinked steps: Data Gathering: Location Data, Attribute Data Data Compilation and Processing Cartographic Visualization and Design Map Drafting and Production The tasks involved depend on Types of Maps Types of Maps • General Purpose Maps: General Reference Maps, Topographic Maps • Special Purpose/ Thematic Maps: Earthquakes in Southern California 2000 Dot Density Map – shows discrete locations/data Choropleth Maps – area-based nominal, ordinal and continuous data Isopleth Map – point-based continuous data isohyets (also isotherms, isobars, isobaths) and contours • Complex Special Purpose/ Thematic Maps: Composite Map – shows discrete + continuous data (+ proportionate circles) • Title (plus any explanatory text) • Legend or Key (See Appendix B) • Direction / Compass: True North, Magnetic North, Magnetic Declination, Isogonic Map (with isogonic lines) Compass directions: Azimuth System (0˚ - 360˚) and Bearing System, with four 90-degree quadrants (NW, NE, SW, SE), e.g., North, 20˚ East (20˚ east of due north) Map Basics – Continued • Map Coordinates: a. Latitudes & Longitudes (Geographic Grid) b. Rectangular/alpha-numeric coordinates Simple Alpha-numeric Location System c. USPLS or Township & Range System • Map Scale: Map scale is the ratio of the distance between two points on the Earth’s surface and the distance between corresponding points on a map Verbal/Written/Stated Scale: 1 inch = 1 mile Bar/Graphic Scale: a graph depicting distances Representative Fraction: One unit of measured distance on a map equal some units of measured distance in the real world – 1: 63360 Also: • Map Projection Used • Date, Author, Publisher, etc. Large-Scale Maps show very small portions of the real world, but with great detail ◦ Large-Scale maps have small denominators i.e., 1:12,000 or 1:24,000 ◦ Topographic maps are examples of large-scale maps Small-Scale maps show very large portions of the real world, but with minimal detail ◦ Small-scale maps have large denominators, i.e., 1:100,000 or 1:1,000,000 ◦ Wall maps are examples of small-scale maps LARGE SCALE SMALL SCALE Modern Technology in Data Gathering, Mapping and GIS • Data Gathering: Surveying – Field Survey using compass, chains, plane table, and theodolite – to GPS Originally developed for military use, GPS is being employed in a variety of ways: • GPS is widely used for ground, air, and sea navigation. • And to produce accurate maps and study land deformation caused by earthquakes and volcanic eruptions. GPS is also showing up in more and more commercial products. The Global Positioning System or GPS consists of 3 parts: 1) Earth orbiting satellites A set of 24 satellites constantly orbiting the Earth and broadcasting their position and time…..Signals from 3 or 4 of them are used to pinpoint a location on earth, using a procedure called trilateration. Trilateration 2) Control and monitoring stations across the Earth 3) GPS receivers owned by individuals and other entities Aerial photography to satellite imaging Multiple Platforms ↓ a) Camera – Traditional and Digital b) Radar (SLAR, Doppler, Sonar) c) Near Infra-red (NIR) and Thermal Infra-red (TIR) Scanners d) Multispectral Remote Sensing – Color Composite Image Typical Remote Sensing Platforms Polar vs. Geostationary Orbits Remote Sensing to Digital Mapping All objects (natural or synthetic) reflect and emit electromagnetic radiation over a range of wavelengths characteristic of the object. The Distinctive reflectance and emitance properties are the spectral signatures of the objects. Remote sensing operates in the wavelength regions of the electromagnetic spectrum where these spectral signatures occur, to identify, map and analyze image features Landsat NIR image of San Francisco Bay “Natural-color” Photograph “False-color” Near infra-red Satellite Image Thermal Infrared (TIR) Image of a Storm System from GOES Satellite Landscape Visualization: The Physical Environments of Cape Town Satellite imagery and elevation data were combined and computer enhanced to produce the 3-D perspective Digital Mapmaking , involves: Converting locational/spatial data into digital data → Cartesian Coordinates (x,y) Automated Contouring Digital Elevation Models: 3-D Representation Dynamic Maps • Interface between Computer Cartography and Data Base Management • A geographic information system, GIS, is a computer-based technology that enters, analyzes, manipulates, and displays geographic information Watch this “GIS Day” video clip from ESRI for a more detail intro to GIS: http://www.youtube.com/watch?v=IL1SKqtWB9Q&feature=related • In a GIS framework both spatial and non-spatial databases are combined into a “geodatabase” • A GIS essentially creates Map Layers of specific thematic maps • By layering the information one on top of the other, a geographer can show, for example, the relationship and degree of connectivity between various land uses and transportation routes in a region. To summarize: • A GIS involves Geocoding, Registration, Mapping, Display, Analysis and other operations • Also, Visualization Models • A Great Planning Tool Watch this for a City’s GIS: http://www.youtube.com/watch?v=BG6XsFi4gfo&feature=related For interactive GIS mapping, go to: GIS City of Santa Clarita


