Prelim activity for Water inquiry lab
advertisement

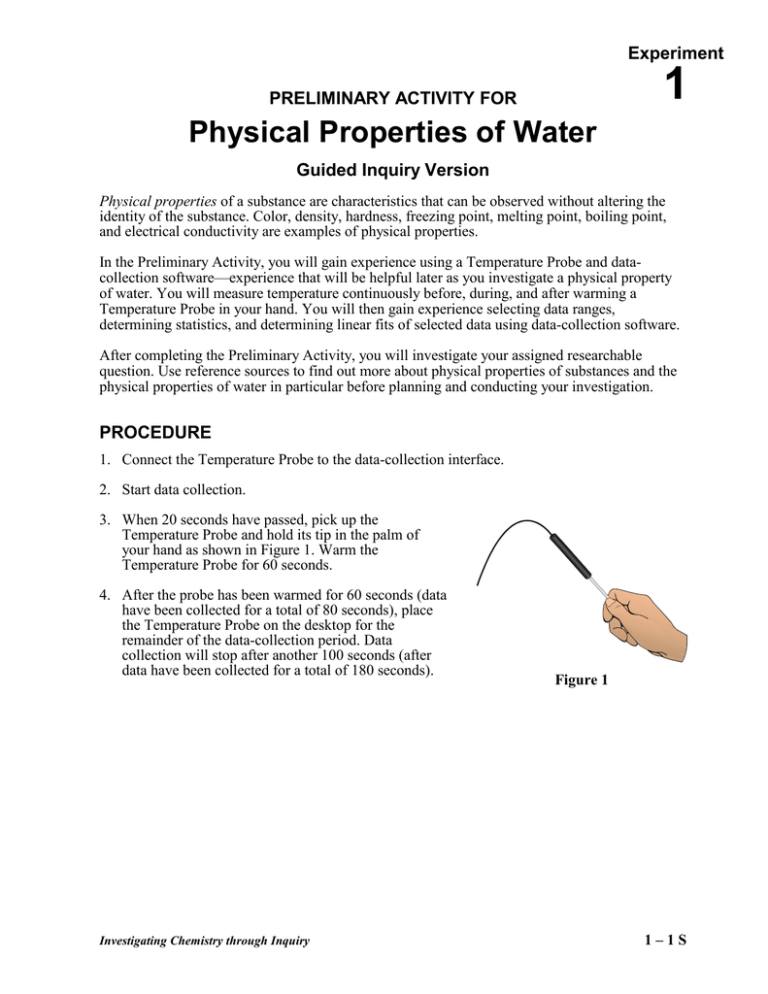
Experiment 1 PRELIMINARY ACTIVITY FOR Physical Properties of Water Guided Inquiry Version Physical properties of a substance are characteristics that can be observed without altering the identity of the substance. Color, density, hardness, freezing point, melting point, boiling point, and electrical conductivity are examples of physical properties. In the Preliminary Activity, you will gain experience using a Temperature Probe and datacollection software—experience that will be helpful later as you investigate a physical property of water. You will measure temperature continuously before, during, and after warming a Temperature Probe in your hand. You will then gain experience selecting data ranges, determining statistics, and determining linear fits of selected data using data-collection software. After completing the Preliminary Activity, you will investigate your assigned researchable question. Use reference sources to find out more about physical properties of substances and the physical properties of water in particular before planning and conducting your investigation. PROCEDURE 1. Connect the Temperature Probe to the data-collection interface. 2. Start data collection. 3. When 20 seconds have passed, pick up the Temperature Probe and hold its tip in the palm of your hand as shown in Figure 1. Warm the Temperature Probe for 60 seconds. 4. After the probe has been warmed for 60 seconds (data have been collected for a total of 80 seconds), place the Temperature Probe on the desktop for the remainder of the data-collection period. Data collection will stop after another 100 seconds (after data have been collected for a total of 180 seconds). Investigating Chemistry through Inquiry Figure 1 1–1S Experiment 1 QUESTIONS 1. Use the Statistics function to determine the minimum and maximum temperatures measured during the 180-minute data-collection period. What was the minimum temperature? What was the maximum temperature? Use the text annotation feature under the insert tab to label these areas on the graph. 2. Select the portion of the graph corresponding to the first 20 seconds of data collection, and then use the Statistics function to determine the mean temperature during this period. What was the mean temperature during the first 20 seconds of data collection? 3. You can see at a glance that the cooling portion of the curve is not linear. To gain some helpful experience, however, let us assume that the curve for the last 30 seconds is linear and determine its slope. Select the last 30 seconds of the graph, and then use the Linear Fit function to determine its slope. This slope corresponds to the cooling rate of the Temperature Probe during this period. What was the cooling rate for your Temperature Probe? Note: The plan that you submit for instructor approval should list laboratory safety concerns, including chemical safety concerns, and specify how you will address these safety concerns during your investigation. 1-2S Investigating Chemistry through Inquiry Physical Properties of Water List of question for students to investigate, 1. What happens to the temperature of water at its boiling point and at it freezing point. 2. How does the melting point of water compare to the freezing temperature? 3. How does temperature of water affect how fast it will freeze? Investigating Chemistry through Inquiry 1-3S


