Acceleration Worksheet: Speed, Time, and Motion
advertisement
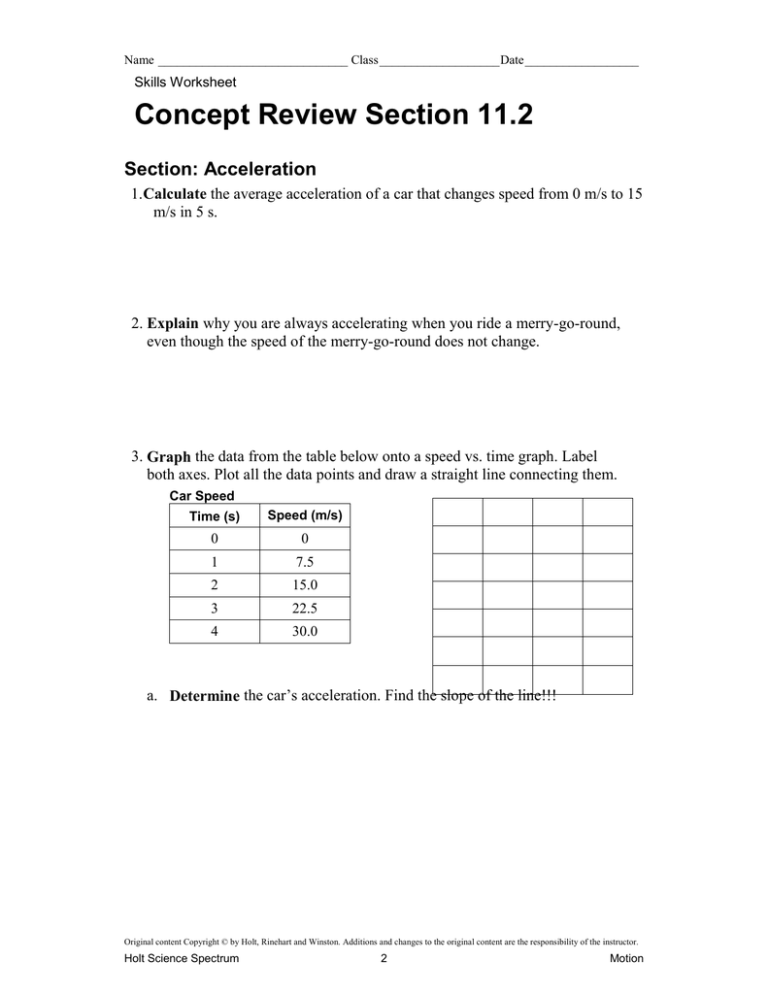
Name ______________________________ Class ___________________ Date __________________ Skills Worksheet Concept Review Section 11.2 Section: Acceleration 1.Calculate the average acceleration of a car that changes speed from 0 m/s to 15 m/s in 5 s. 2. Explain why you are always accelerating when you ride a merry-go-round, even though the speed of the merry-go-round does not change. 3. Graph the data from the table below onto a speed vs. time graph. Label both axes. Plot all the data points and draw a straight line connecting them. Car Speed Time (s) Speed (m/s) 0 0 1 7.5 2 15.0 3 22.5 4 30.0 a. Determine the car’s acceleration. Find the slope of the line!!! Original content Copyright © by Holt, Rinehart and Winston. Additions and changes to the original content are the responsibility of the instructor. Holt Science Spectrum 2 Motion Name ______________________________ Class ___________________ Date __________________ 4. Calculate how long it takes for a stone falling from a bridge with an average acceleration downward of 9.8 m/s2 to hit the water. The stone starts from rest and hits the water with a velocity of 12.3 m/s. 5. Identify the straight-line accelerations below as either speeding up or slowing down. _____________________ a. 0.75 m/s2 _____________________ b. 24.8 m/s2 _____________________ c. –3.9 m/s2 Original content Copyright © by Holt, Rinehart and Winston. Additions and changes to the original content are the responsibility of the instructor. Holt Science Spectrum 3 Motion
