Table 3_R1.docx
advertisement
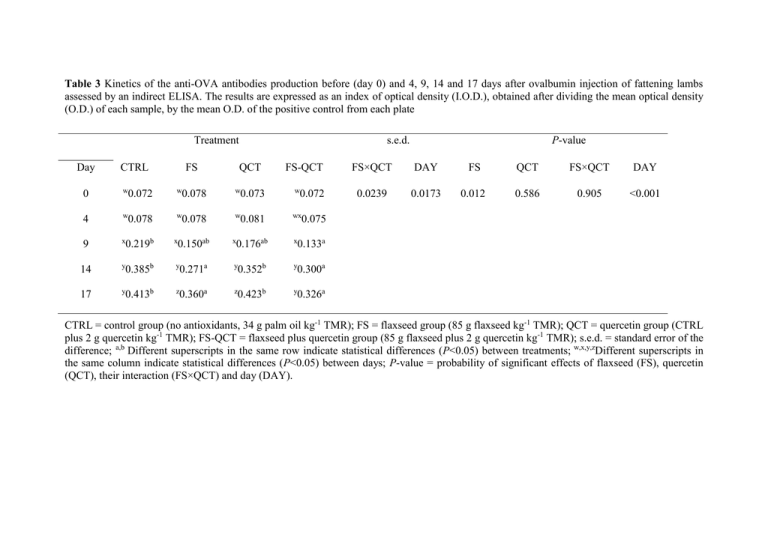
Table 3 Kinetics of the anti-OVA antibodies production before (day 0) and 4, 9, 14 and 17 days after ovalbumin injection of fattening lambs assessed by an indirect ELISA. The results are expressed as an index of optical density (I.O.D.), obtained after dividing the mean optical density (O.D.) of each sample, by the mean O.D. of the positive control from each plate Treatment Day CTRL FS s.e.d. QCT FS-QCT 0 w w w w 4 w w w 0.081 wx 9 x x 0.150ab x 0.176ab x 14 y y 0.271a y 0.352b y 17 y z 0.360a z 0.423b y 0.072 0.078 0.219b 0.385b 0.413b 0.078 0.078 0.073 0.072 P-value FS×QCT DAY FS QCT FS×QCT DAY 0.0239 0.0173 0.012 0.586 0.905 <0.001 0.075 0.133a 0.300a 0.326a CTRL = control group (no antioxidants, 34 g palm oil kg-1 TMR); FS = flaxseed group (85 g flaxseed kg-1 TMR); QCT = quercetin group (CTRL plus 2 g quercetin kg-1 TMR); FS-QCT = flaxseed plus quercetin group (85 g flaxseed plus 2 g quercetin kg-1 TMR); s.e.d. = standard error of the difference; a,b Different superscripts in the same row indicate statistical differences (P<0.05) between treatments; w,x,y,zDifferent superscripts in the same column indicate statistical differences (P<0.05) between days; P-value = probability of significant effects of flaxseed (FS), quercetin (QCT), their interaction (FS×QCT) and day (DAY).
