Discussion of Sample Paper

Examining an actual research paper
Astronomy, like all science, is quantitative and necessitates making measurements.
As an example of this let’s look at a research paper (provided separately as a file) by Slesnick, Hillenbrand and Massey on “The Star Formation History and Mass
Function of the Double Cluster h and x Persei”. You may not want to read the entire paper, but scanning sections of it will illustrate the process an astronomer might follow. To begin, the interplay of reading other’s research and learning all that is known about a subject will lead a scientists to formulate their own questions. The question may require some new images, say, of a star cluster. In this case, the authors applied to Kitt Peak National Observatory for observing time. Their proposal was selected to receive time (there are always more requests than there is telescope time).They made their observations with the same telescope that you will use when you come to Kitt Peak.
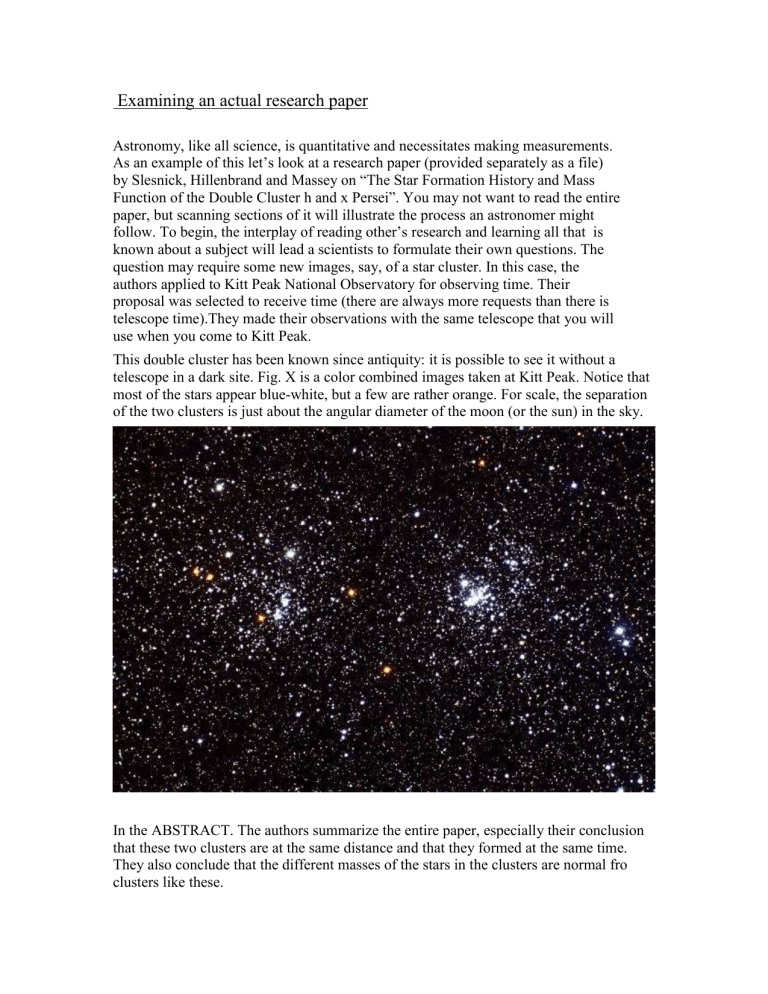
This double cluster has been known since antiquity: it is possible to see it without a telescope in a dark site. Fig. X is a color combined images taken at Kitt Peak. Notice that most of the stars appear blue-white, but a few are rather orange. For scale, the separation of the two clusters is just about the angular diameter of the moon (or the sun) in the sky.
In the ABSTRACT. The authors summarize the entire paper, especially their conclusion that these two clusters are at the same distance and that they formed at the same time.
They also conclude that the different masses of the stars in the clusters are normal fro clusters like these.
In the INTRODUCTION, they discuss what other astronomers have learned about the cluster, and the controversy over the age and formation stage of these clusters. They explain that in addition to using ccd images, they have taken spectra of hundreds of stars.
In OBSERVATIONS AND DATA REDUCTION they present a detailed explanation of every step of their work. The first sentence, “UBV photometry was obtained…” tells others that they took ccd images through 3 filters called U (for very blue), B (for blue) and V (for visual, or red). If you skip the details in sect. 2.1 but look at their Table 1, you find the magnitudes and colors (remember, quantitatively astronomers use the difference in magnitude between two filters and call it the “color”) they have measured. This table contains only the first 5 stars of 4528, but the rest of the data is to be found in electronic form. Publishing all these numbers in a paper journal would be out of the question! Table
1 also includes the spectral types: the results of classifying the spectra of several hundred of these stars. (sect. 2.2)
In 3.ANALYSIS the authors use their measurements to draw conclusions. The details here are beyond what we need to discuss, but Fig. 7 presents data in a form known to every elementary astronomy student. This is the H-R diagram. Each filled circle represents a star with both photometry (through 3 different filters) and spectroscopy; open circles are stars with only photometry.
In sect 4. DISCUSSION they do just that. What does it all mean?
Finally, Sect 5 SUMMARY, presents a final few words as well as acknowledgements of both those who inspired the work and the funding agency that made it possible. The paper ends with a list of all references, all papers referred to in the body of the article. Now that you have finished scanning this paper, you might note that under the authors names is a line “Received 2002 February 27; accepted 2002 May 18” This indicates that after they submitted the paper to the journal in which is was ultimately published, the editor sent the paper to an anonymous referee (but quite probably someone who has done similar work)
Not until this referee was satisfied with the paper could it be accepted for publication.


