Unit 07 - Sensors - temperature - the thermistor Lesson Element - Learner Task (DOC, 1MB)
advertisement
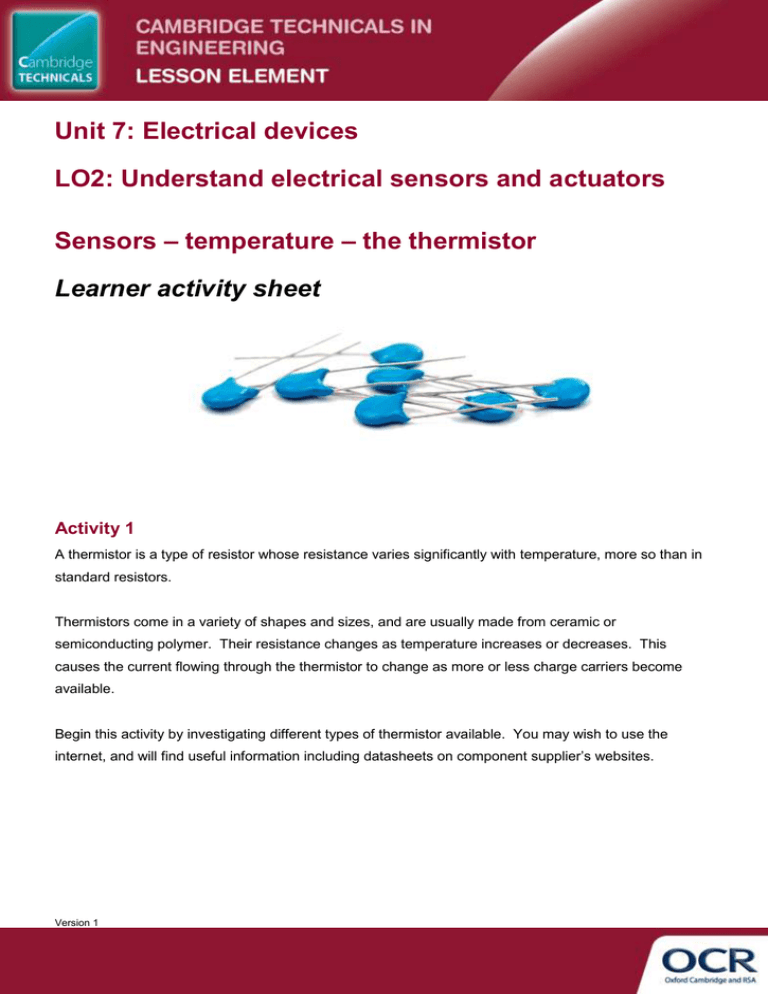
Unit 7: Electrical devices LO2: Understand electrical sensors and actuators Sensors – temperature – the thermistor Learner activity sheet Activity 1 A thermistor is a type of resistor whose resistance varies significantly with temperature, more so than in standard resistors. Thermistors come in a variety of shapes and sizes, and are usually made from ceramic or semiconducting polymer. Their resistance changes as temperature increases or decreases. This causes the current flowing through the thermistor to change as more or less charge carriers become available. Begin this activity by investigating different types of thermistor available. You may wish to use the internet, and will find useful information including datasheets on component supplier’s websites. Version 1 Answer the following questions: 1. What is a NTC thermistor and how does it work? 2. What is a PTC thermistor and how does it work? 3. What applications are thermistors used for? Version 1 Activity 2 In Activity 2 you are going to conduct an experiment to investigate the characteristics of a thermistor. Equipment you will need: Thermistor (an NTC type with 100 at 25C is suitable) Power supply (regulated, fixed voltage, DC) Ammeter (A) (you could use the ammeter function in a multimeter) Connecting wires Timer or stopwatch Thermometer Beaker Heat resistant mat Supply of hot water (from a kettle) 1. Set up the experiment as shown below using a heat-resistant beaker. Make sure that the beaker is on a heat-resistant mat or surface. A 5 – 9 V DC Thermometer Hot water Thermistor Version 1 2. Pour boiling water into the beaker (take care to use suitable personal protective equipment). 3. Take readings of current at regular time intervals as the water cools (you will have to determine what time intervals you are going to use as you start to see the temperature fall). Tabulate your results of temperature and current (and also resistance calculated using Ohm’s Law R = V/I): Temperature 4. Current Resistance Plot a graph of temperature (x axis) vs. current (y axis). You could plot this using graph paper, or could use a spreadsheet. 5. Plot also a graph of temperature (x axis) vs. resistance (y axis). Questions: 1. What do you notice about the shape of the graphs? 2. What is happening to the resistance of the thermistor? Version 1 3. If you have access to the datasheet for the thermistor being used, do your results agree with the current vs. temperature and/or resistance vs. temperature graphs in the data? If not, explain why you think they do not match. You could repeat the activity using a thermocouple. You would need to begin by investigating how a thermocouple works, and how you can measure its output signal. Version 1
