Psychology 490 Spring 2015 Extra or Replacement Credit Name: __________________
advertisement
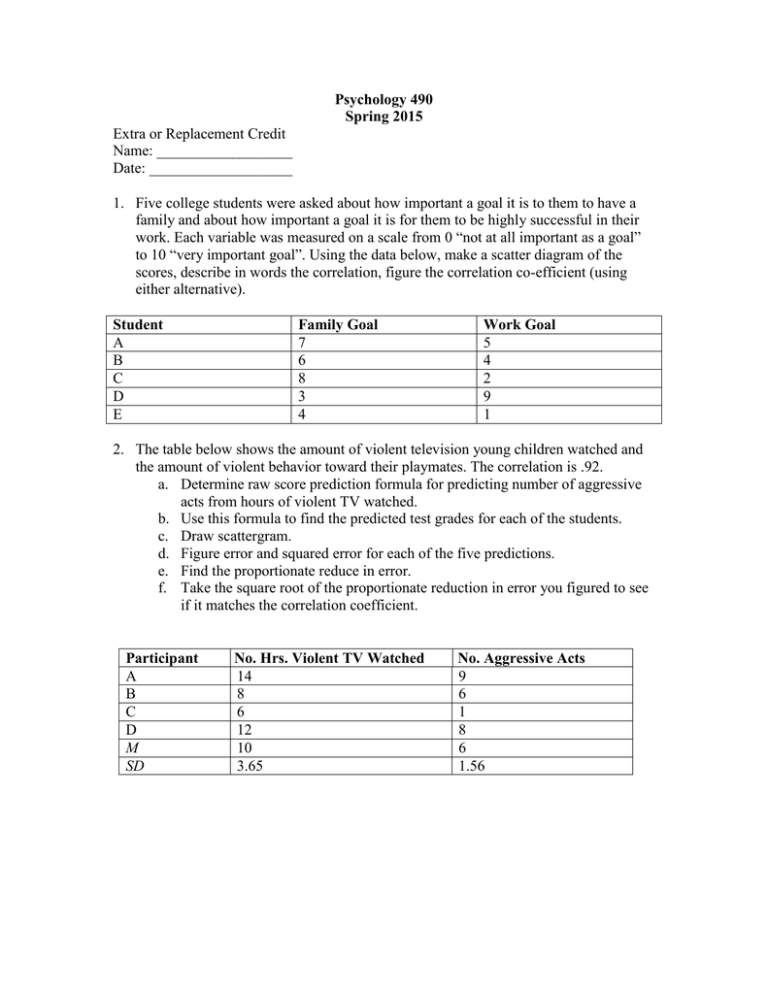
Psychology 490 Spring 2015 Extra or Replacement Credit Name: __________________ Date: ___________________ 1. Five college students were asked about how important a goal it is to them to have a family and about how important a goal it is for them to be highly successful in their work. Each variable was measured on a scale from 0 “not at all important as a goal” to 10 “very important goal”. Using the data below, make a scatter diagram of the scores, describe in words the correlation, figure the correlation co-efficient (using either alternative). Student A B C D E Family Goal 7 6 8 3 4 Work Goal 5 4 2 9 1 2. The table below shows the amount of violent television young children watched and the amount of violent behavior toward their playmates. The correlation is .92. a. Determine raw score prediction formula for predicting number of aggressive acts from hours of violent TV watched. b. Use this formula to find the predicted test grades for each of the students. c. Draw scattergram. d. Figure error and squared error for each of the five predictions. e. Find the proportionate reduce in error. f. Take the square root of the proportionate reduction in error you figured to see if it matches the correlation coefficient. Participant A B C D M SD No. Hrs. Violent TV Watched Violent Tv 14 8 6 12 10 3.65 No. Aggressive Acts 9 6 1 8 6 1.56
