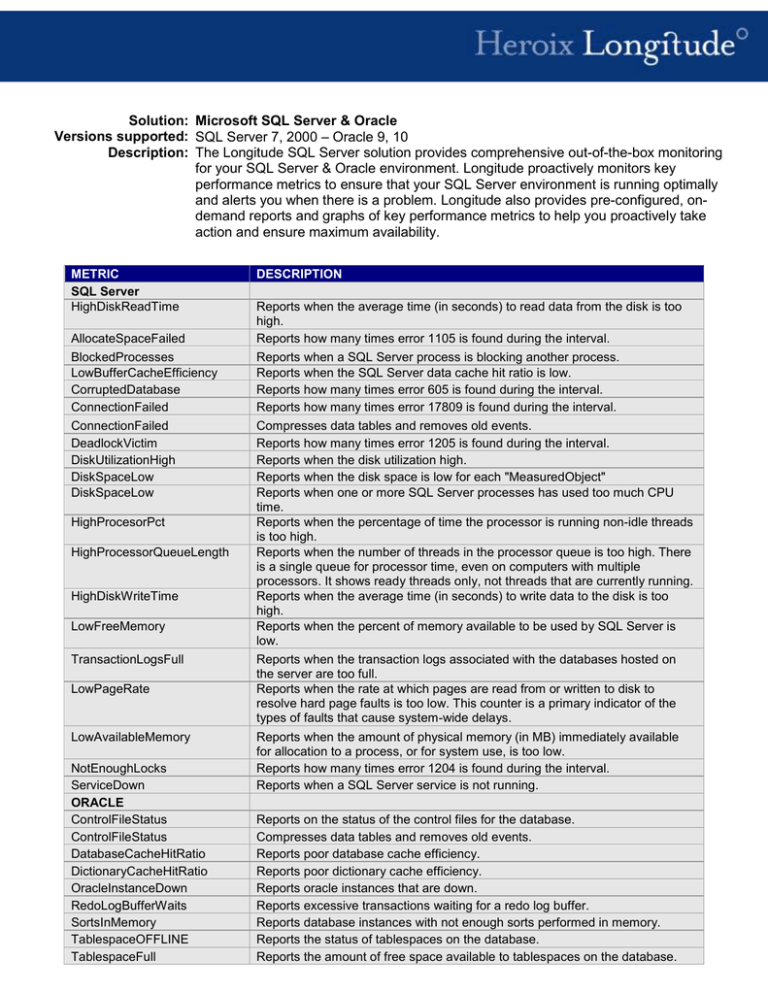
Solution: Microsoft SQL Server & Oracle
Versions supported: SQL Server 7, 2000 – Oracle 9, 10
Description: The Longitude SQL Server solution provides comprehensive out-of-the-box monitoring
for your SQL Server & Oracle environment. Longitude proactively monitors key
performance metrics to ensure that your SQL Server environment is running optimally
and alerts you when there is a problem. Longitude also provides pre-configured, ondemand reports and graphs of key performance metrics to help you proactively take
action and ensure maximum availability.
METRIC
SQL Server
HighDiskReadTime
DESCRIPTION
AllocateSpaceFailed
Reports when the average time (in seconds) to read data from the disk is too
high.
Reports how many times error 1105 is found during the interval.
BlockedProcesses
LowBufferCacheEfficiency
CorruptedDatabase
ConnectionFailed
Reports when a SQL Server process is blocking another process.
Reports when the SQL Server data cache hit ratio is low.
Reports how many times error 605 is found during the interval.
Reports how many times error 17809 is found during the interval.
ConnectionFailed
DeadlockVictim
DiskUtilizationHigh
DiskSpaceLow
DiskSpaceLow
Compresses data tables and removes old events.
Reports how many times error 1205 is found during the interval.
Reports when the disk utilization high.
Reports when the disk space is low for each "MeasuredObject"
Reports when one or more SQL Server processes has used too much CPU
time.
Reports when the percentage of time the processor is running non-idle threads
is too high.
Reports when the number of threads in the processor queue is too high. There
is a single queue for processor time, even on computers with multiple
processors. It shows ready threads only, not threads that are currently running.
Reports when the average time (in seconds) to write data to the disk is too
high.
Reports when the percent of memory available to be used by SQL Server is
low.
HighProcesorPct
HighProcessorQueueLength
HighDiskWriteTime
LowFreeMemory
TransactionLogsFull
LowPageRate
LowAvailableMemory
NotEnoughLocks
ServiceDown
ORACLE
ControlFileStatus
ControlFileStatus
DatabaseCacheHitRatio
DictionaryCacheHitRatio
OracleInstanceDown
RedoLogBufferWaits
SortsInMemory
TablespaceOFFLINE
TablespaceFull
Reports when the transaction logs associated with the databases hosted on
the server are too full.
Reports when the rate at which pages are read from or written to disk to
resolve hard page faults is too low. This counter is a primary indicator of the
types of faults that cause system-wide delays.
Reports when the amount of physical memory (in MB) immediately available
for allocation to a process, or for system use, is too low.
Reports how many times error 1204 is found during the interval.
Reports when a SQL Server service is not running.
Reports on the status of the control files for the database.
Compresses data tables and removes old events.
Reports poor database cache efficiency.
Reports poor dictionary cache efficiency.
Reports oracle instances that are down.
Reports excessive transactions waiting for a redo log buffer.
Reports database instances with not enough sorts performed in memory.
Reports the status of tablespaces on the database.
Reports the amount of free space available to tablespaces on the database.
Corporate Headquarters
57 Wells Avenue
Newton, MA 02459
Telephone: 800-229-6500 / 617-527-1550
www.heroix.com
email: info@heroix.com
Features and support may vary by platform. Heroix Corporation believes that the information in this document is accurate as of its
publication date; such information is subject to change without notice. Heroix is not responsible for any inadvertent errors. Heroix, the
Heroix logo, and Heroix Longitude are trademarks of Heroix Corporation. All other trademarks are property of their respective
owners. © 2005 Heroix Corporation. All rights reserved.
