Sample Poster
advertisement
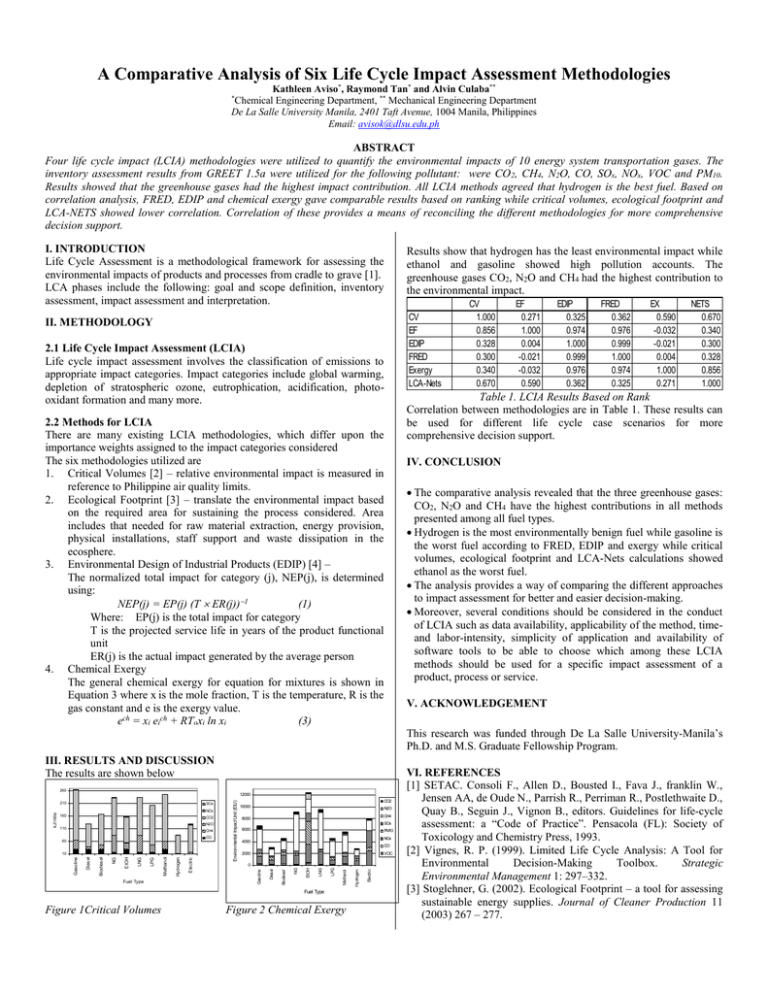
A Comparative Analysis of Six Life Cycle Impact Assessment Methodologies Kathleen Aviso*, Raymond Tan* and Alvin Culaba** Chemical Engineering Department, ** Mechanical Engineering Department De La Salle University Manila, 2401 Taft Avenue, 1004 Manila, Philippines Email: avisok@dlsu.edu.ph * ABSTRACT Four life cycle impact (LCIA) methodologies were utilized to quantify the environmental impacts of 10 energy system transportation gases. The inventory assessment results from GREET 1.5a were utilized for the following pollutant: were CO 2, CH4, N2O, CO, SOx, NOx, VOC and PM10. Results showed that the greenhouse gases had the highest impact contribution. All LCIA methods agreed that hydrogen is the best fuel. Based on correlation analysis, FRED, EDIP and chemical exergy gave comparable results based on ranking while critical volumes, ecological footprint and LCA-NETS showed lower correlation. Correlation of these provides a means of reconciling the different methodologies for more comprehensive decision support. I. INTRODUCTION Life Cycle Assessment is a methodological framework for assessing the environmental impacts of products and processes from cradle to grave [1]. LCA phases include the following: goal and scope definition, inventory assessment, impact assessment and interpretation. Results show that hydrogen has the least environmental impact while ethanol and gasoline showed high pollution accounts. The greenhouse gases CO2, N2O and CH4 had the highest contribution to the environmental impact. II. METHODOLOGY CV EF EDIP FRED Exergy LCA-Nets 2.1 Life Cycle Impact Assessment (LCIA) Life cycle impact assessment involves the classification of emissions to appropriate impact categories. Impact categories include global warming, depletion of stratospheric ozone, eutrophication, acidification, photooxidant formation and many more. 2.2 Methods for LCIA There are many existing LCIA methodologies, which differ upon the importance weights assigned to the impact categories considered The six methodologies utilized are 1. Critical Volumes [2] – relative environmental impact is measured in reference to Philippine air quality limits. 2. Ecological Footprint [3] – translate the environmental impact based on the required area for sustaining the process considered. Area includes that needed for raw material extraction, energy provision, physical installations, staff support and waste dissipation in the ecosphere. 3. Environmental Design of Industrial Products (EDIP) [4] – The normalized total impact for category (j), NEP(j), is determined using: NEP(j) = EP(j) (T ER(j))1 (1) Where: EP(j) is the total impact for category T is the projected service life in years of the product functional unit ER(j) is the actual impact generated by the average person 4. Chemical Exergy The general chemical exergy for equation for mixtures is shown in Equation 3 where x is the mole fraction, T is the temperature, R is the gas constant and e is the exergy value. ech = xi eich + RToxi ln xi (3) CV 1.000 0.856 0.328 0.300 0.340 0.670 EF 0.271 1.000 0.004 -0.021 -0.032 0.590 EDIP 0.325 0.974 1.000 0.999 0.976 0.362 FRED 0.362 0.976 0.999 1.000 0.974 0.325 EX 0.590 -0.032 -0.021 0.004 1.000 0.271 NETS 0.670 0.340 0.300 0.328 0.856 1.000 Table 1. LCIA Results Based on Rank Correlation between methodologies are in Table 1. These results can be used for different life cycle case scenarios for more comprehensive decision support. IV. CONCLUSION The comparative analysis revealed that the three greenhouse gases: CO2, N2O and CH4 have the highest contributions in all methods presented among all fuel types. Hydrogen is the most environmentally benign fuel while gasoline is the worst fuel according to FRED, EDIP and exergy while critical volumes, ecological footprint and LCA-Nets calculations showed ethanol as the worst fuel. The analysis provides a way of comparing the different approaches to impact assessment for better and easier decision-making. Moreover, several conditions should be considered in the conduct of LCIA such as data availability, applicability of the method, timeand labor-intensity, simplicity of application and availability of software tools to be able to choose which among these LCIA methods should be used for a specific impact assessment of a product, process or service. V. ACKNOWLEDGEMENT This research was funded through De La Salle University-Manila’s Ph.D. and M.S. Graduate Fellowship Program. III. RESULTS AND DISCUSSION The results are shown below 260 PM10 NOx 4000 CO 2000 VOC Fuel Type Figure 1Critical Volumes Figure 2 Chemical Exergy Electric 0 Hydrogen Electric Hydrogen LPG Fuel Type Methanol LNG NG EtOH Diesel Biodiesel Gasoline 10 SOx LPG CO 60 CH4 6000 Methanol CH4 LNG 110 N2O 8000 NG N2O EtOH CO2 CO2 10000 Diesel 160 Biodiesel kJ/mile NOx Gasoline SOx Environmental Impact Unit (EIU) 12000 210 VI. REFERENCES [1] SETAC. Consoli F., Allen D., Bousted I., Fava J., franklin W., Jensen AA, de Oude N., Parrish R., Perriman R., Postlethwaite D., Quay B., Seguin J., Vignon B., editors. Guidelines for life-cycle assessment: a “Code of Practice”. Pensacola (FL): Society of Toxicology and Chemistry Press, 1993. [2] Vignes, R. P. (1999). Limited Life Cycle Analysis: A Tool for Environmental Decision-Making Toolbox. Strategic Environmental Management 1: 297–332. [3] Stoglehner, G. (2002). Ecological Footprint – a tool for assessing sustainable energy supplies. Journal of Cleaner Production 11 (2003) 267 – 277.
