CURVE SKETCHING.doc
advertisement

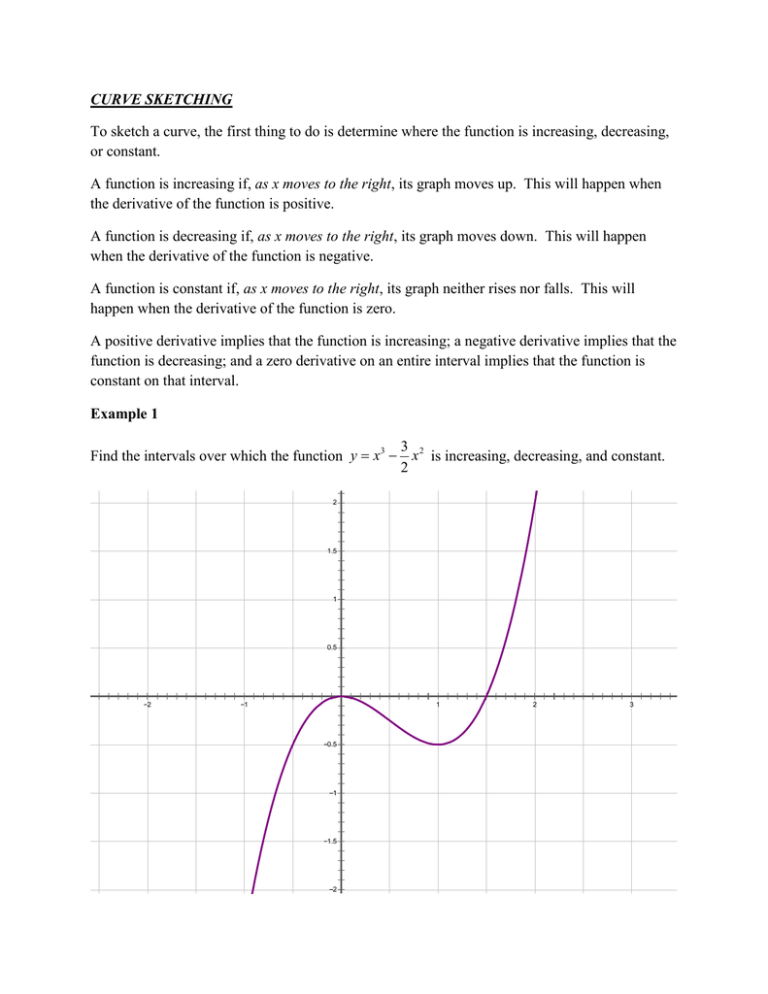
CURVE SKETCHING To sketch a curve, the first thing to do is determine where the function is increasing, decreasing, or constant. A function is increasing if, as x moves to the right, its graph moves up. This will happen when the derivative of the function is positive. A function is decreasing if, as x moves to the right, its graph moves down. This will happen when the derivative of the function is negative. A function is constant if, as x moves to the right, its graph neither rises nor falls. This will happen when the derivative of the function is zero. A positive derivative implies that the function is increasing; a negative derivative implies that the function is decreasing; and a zero derivative on an entire interval implies that the function is constant on that interval. Example 1 Find the intervals over which the function y x3 3 2 x is increasing, decreasing, and constant. 2 2 1.5 1 0.5 2 1 1 0.5 1 1.5 2 2 3 Guidelines for finding intervals on which a function is increasing or decreasing 1. Locate the critical values (the places where the derivative is zero or does not exist), and use these numbers to determine test intervals. 2. Determine the sign of f x at one test value in each interval. 3. Use the information in step 2 to determine if the function is increasing, decreasing, or constant in that interval. After you find the intervals over which a function is increasing or decreasing, it is not difficult to locate the relative extrema of a function. The First Derivative Test is used to perform this task. The First Derivative Test The First Derivative Test is used to determine whether the function has a relative minimum or a relative maximum. Here’s what it says: If c is a critical number of a continuous function on an open interval containing c, and if the function is differentiable on the interval, except possibly at c, then f c can be classified as follows: f c has a relative minimum at c if f x changes from negative to positive at c. f c has a relative maximum at c if f x changes from positive to negative at c. f c has neither a relative minimum nor a relative maximum at c if f x is positive on both sides of c or is negative on both sides of c. Example 2 Find the relative extrema of the function f x 1 x sin x on the interval 0, 2 . 2 4 3.5 3 2.5 2 1.5 1 0.5 π π 2π 3 3 3 0.5 1 1.5 π 4π 5π 3 3 2π Example 3 Find the relative extrema of f x x 2 4 2/3 8 7 6 5 4 3 2 1 6 4 2 2 1 2 4 6 8 Example 4 Find the relative extrema of f x x4 1 . x2 9 8 7 6 5 4 3 2 1 4 3 2 1 1 1 2 3 4 CONCAVITY AND THE SECOND DERIVATIVE Definition of concavity: If f is a differentiable function on an open interval, then the graph of f is concave upward if f is increasing on the interval and concave downward if f is decreasing on the interval. According to the definition, to find the open intervals on which the graph of the function f is concave upward or concave downward, you need to find the intervals on which f is increasing or decreasing. To do this, we use the following Test for Concavity: If f is a function whose second derivative exists on an open interval, then: If f 0 for all x in the interval, then the graph of f is concave upward on the interval. If f 0 for all x in the interval, then the graph of f is concave upward on the interval. Example 5 Determine the open intervals on which the graph of f x 6 is concave upward or x 3 2 downward. 4.5 4 3.5 3 2.5 2 1.5 1 0.5 4 3 2 1 1 0.5 2 3 4 Example 6 Determine the open intervals on which the graph of f x x2 1 is concave upward or x2 4 downward. 8 6 4 2 15 10 5 5 2 4 6 10 Points of Inflection The points where the graph of a function changes concavity are called the points of inflection. A point c, f c is a point of inflection if either f c 0 or f x does not exist at x c . To locate possible points of inflection, you can determine the values of x for which f c 0 or f x does not exist. This is similar to the procedure for locating relative extrema. Example 7 Find the points of inflection and discuss the concavity of the graph of f x x4 4 x3 . 60 50 40 30 20 10 4 3 2 1 1 10 20 30 40 2 3 4 5 6 The Second Derivative Test In addition to testing for concavity, the second derivative can be used to perform a simple test for relative maxima and minima. The test is based on the fact that if the graph of a function f is concave upward on an open interval containing c, and f c 0 , then f c must be a relative minimum. Similarly, if the graph of a function f is concave downward on an open interval containing c, and f c 0 , then f c must be a relative maximum. Here is the Second Derivative Test: Let f be a function such that f c 0 and the second derivative exists on an open interval containing c. If f c 0 , then f has a relative minimum at c, f c . If f c 0 , then f has a relative maximum at c, f c . If f c 0 , the test fails. The function may have a relative maximum, a relative minimum or neither. In such cases, you can use the First Derivative Test. Example 8 Find the relative extrema for f x 3x5 5x3 using the Second Derivative Test. 3 2.5 2 1.5 1 0.5 4 3 2 1 1 0.5 1 1.5 2 2.5 3 2 3 4 Limits at Infinity Limits at infinity are used to discuss the “end behavior” of a function on an infinite interval. If the graph of a function approaches a line as x increases without bound, that line is the horizontal asymptote. Definition: The line y L is a horizontal asymptote of the graph of f if lim f x L or lim f x L x x Example 9 Find the horizontal asymptote of each: 2 x2 f x 5 f x 2x 1 x 1 f x 2x 5 3x 2 1 2 x2 5 f x 2 3x 1 f x 2 x3 5 3x 2 1 f x 1 x 1 f x 2 3x 2 2 x2 1 (This one has two horizontal asymptotes) Infinite Limits at Infinity Sometimes the graph of a function does not approach a finite limit as x increases (or decreases) without bound. lim f x means that the graph rises infinitely as x increases without bound to the x right. lim f x means that the graph falls infinitely as x increases without bound to the x right. lim f x means that the graph rises infinitely as x increases without bound to the x left. lim f x means that the graph falls infinitely as x increases without bound to the x left. Example 10 Find each limit and describe what this means about the graph of the function. lim x3 x lim x3 x 2 x2 4 x x x 1 lim 2x2 4x x x 1 lim 5 30 4 25 3 20 15 2 10 1 5 15 6 4 2 2 4 10 5 5 6 5 1 10 2 15 20 3 25 4 30 10 15 Cusps Cusps are the points at which a graph makes “abrupt” changes in directions. The derivative does not exist at these points, although the graph may be continuous at these points. The graphs below illustrate cusps. 14 14 4 12 12 10 10 8 8 6 6 4 4 2 2 2 2 4 6 8 10 12 2 14 2 2 2 4 4 6 6 4 6 8 If a curve has a cusp at a particular point, the following will be true: The curve will be continuous at the cusp. The derivative will not exist at the cusp. The derivative of the function will approach at one side of the cusp and will approach at the other side of the cusp. In order to find a cusp, you need to look at points where the first derivative is undefined, and then evaluate the limit of the derivative as x approaches the cusp from both sides. Example 11 Determine if the graph of f x 3 x 1 2/3 2 has a cusp, and then locate the cusp. 14 12 10 8 6 4 2 4 2 2 2 4 6 4 6 8 10 12 14 Curve Sketching To sketch a curve, consider this four-part analysis that’ll give you all the information you need. Test the Function Find where f x 0 . This tells you the x-intercepts (or roots). By setting x 0 , we can determine the y-intercept. Finally, find any horizontal and/or vertical asymptotes. Test the First Derivative Find where f x 0 . This gives you the critical points. We can determine whether the curve is rising or falling, as well as where the maxima and minima are. It’s also possible to determine if the curve has any points where it’s nondifferentiable. Test the Second Derivative Find where f x 0 . This shows you the where any points of inflection are. These points are where the graph of the function changes concavity. Then we can determine where the graph curves upward and where it curves downward. Test End Behavior Look at what the general shape of the graph will be, based on the values of y for very large values of x . Here are things to remember: 1. When f x 0 , the curve is rising. When f x 0 , the curve is falling. When f x 0 or f x does not exist, the curve is at a critical point. 2. When f x 0 , the curve is “concave up.” When f x 0 , the curve is “concave down.” When f x 0 , the curve is at a point of inflection. 3. The y-coordinates of each critical point are found by plugging the x-value into the original function. Example 12 Sketch the graph of f x x3 12 x . Step 1 Find intercepts: x-intercepts y-intercept x3 12 x 0 x( x 2 12) 0 x x 12 y 03 12 0 0 x 12 0 x 0, x 12 There are no asymptotes (polynomial functions do not have asymptotes). x-intercepts: 0, 0 , y-intercept: 0, 0 12, 0 , 12, 0 Step 2 Find critical points by taking the derivative of the function. f x 3x2 12 Set the derivative equal to zero and solve for x: 3x 2 12 0 3 x2 4 0 3 x 2 x 2 0 x 2 Next, plug x 2 and x 2 into the original equation. y 2 12 2 8 24 16 3 y 2 12 2 8 24 16 3 Critical points are at 2, 16 and 2, 16 . Step 3 Now take the second derivative to find any points of inflection. f x 6 x Set the derivative equal to zero and solve for x: 6x 0 x0 The curve has a point of inflection at 0, 0 . Now plug the critical values (found in step 2) into the second derivative to determine whether is a maximum or a minimum. f 2 6 2 12 . This is positive, so the curve has a minimum at 2, 16 and the curve is concave up at that point. f 2 6 2 12 . This is negative, so the curve has a maximum at 2, 16 and the curve is concave down there. Armed with this information, we can now plot the graph. Example 13 Sketch the graph of f x x4 2 x3 2 x2 1. Step 1 Find intercepts: If the equation doesn’t factor easily, it’s best not to bother to find the function’s roots. y-intercept y f 0 0 2 0 2 0 1 1 4 3 2 There are no asymptotes (polynomial functions do not have asymptotes). x-intercepts: Not easy to find. Maybe use a calculator or don’t bother. y-intercept: 0, 1 Step 2 Find critical points by taking the derivative of the function. f x 4 x3 6 x 2 4 x Set the derivative equal to zero and solve for x: 4 x3 6 x 2 4 x 0 2 x 2 x 2 3x 2 0 2 x 2 x 1 x 2 0 x 0, Next, plug x 0 , x 1 , 2 2 1 , and x 2 into the original equation. 2 y f 0 0 2 0 2 0 1 1 4 3 4 2 3 2 13 1 1 1 1 y f 2 2 1 16 2 2 2 2 y f 2 2 2 2 2 2 1 7 4 3 1 13 Critical points are at 0, 1 , , , and 2 16 2 2, 7 . Step 3 Now take the second derivative to find any points of inflection. f x 12x2 12x 4 Set the derivative equal to zero and solve for x: 12 x 2 12 x 4 0 4 3x 2 3x 1 0 3x 2 3x 1 0 3 21 6 x 0.26, 1.26 x Now find the y-coordinates for the points above: y f 0.26 0.26 2 0.26 2 0.26 1 0.90 4 3 2 y f 1.26 1.26 2 1.26 2 1.26 1 3.66 4 3 2 The curve has two points of inflection at 0.26, 0.90 and 1.66, 3.66 . Now plug the critical values (found in step 2) into the second derivative to determine whether is a maximum or a minimum. f 0 12 0 12 0 4 4 . 2 This is negative, so the curve has a maximum at 0, 1 and the curve is concave down at that point. 2 1 1 1 f 12 12 4 5 . This is positive, so the curve has a minimum at 2 2 2 1 13 , and the curve is concave up there. 2 16 f 2 12 2 12 2 4 20 . This is positive, so the curve has a minimum at 2 2, 7 and the curve is concave up there. We can now plot the curve. Example 14 Sketch the graph of f x 2 x2/ 3 . Step 1 Find intercepts: x-intercepts y-intercept 2 x2/ 3 0 x2/ 3 2 x 2/3 3/ 2 2 f 0 2 0 3/ 2 2/3 2 x 23/ 2 2 2 There are no asymptotes (there are no places where the function is undefined). x-intercepts: 2 2 y-intercept: 0, 2 2, 0 , 2, 0 Step 2 Find critical points by taking the derivative of the function. 2 2 f x x 1/ 3 3 3 3 x Set the derivative equal to zero and solve for x: 2 3 3 x 0 We have a problem here. There are no values of x for which the derivative is zero. However, at x 0 , the derivative is undefined. Therefore, x 0 is a critical number of the function. We need to see if the graph has a cusp when x 0 . If we look at the limit as x approaches 0 from both sides, we can determine whether the graph has a cusp. 2 2 lim 3 x 0 3 3 x 1 2 lim 3 x 0 3 x 2 2 lim 3 x 0 3 3 x 1 2 lim 3 x 0 3 x Therefore, the curve has a cusp at 0, 2 . There are no other critical points. We can see that when x is negative, the derivative is positive. Therefore, the curve is rising to the left of zero. We can also see that when x is positive, the derivative is negative. Therefore, the curve is falling to the right of zero. 2 Step 3 Now take the second derivative to find any points of inflection. Use f x x 1/ 3 . 3 f x 2 4 / 3 2 2 2 x 4/3 4 9 9x 9 x1/ 3 9 3x 4 Set the derivative equal to zero and solve for x: 2 9 3 4 0 x Again, there are no values of x where this is zero. There are no inflection points. In fact, the second derivative is positive at all values of x except 0. Therefore, the graph is everywhere concave up. We can now plot the curve. Example 15 Sketch the graph of f x 3x . x2 Step 1 Find intercepts. A fraction can only equal zero when the numerator is zero. So, to find the x-intercepts, set the numerator equal to 0 and solve for x. x-intercepts 3x 0 x2 3x 0 y-intercept f 0 x0 x-intercepts: 0, 0 y-intercept: 0, 0 30 0 2 0 0 2 Next, look for asymptotes. The denominator is undefined at x 2 , so there is a vertical asymptote at x 2 . Take the left-hand and right-hand limits of the function at x 2 : lim x 2 3x x2 and lim x 2 3x x2 This means that the graph rises infinitely to the left of x 2 and falls infinitely to the right of x 2 . 3x 3x 3 3 lim x lim 3. As x moves infinitely to the right, we have lim x x 2 x x 2 x 2 1 0 1 x x x 3x 3x x lim 3 3 3 . lim As x moves infinitely to the left, we have lim x x 2 x x 2 x 2 1 0 1 x x x Therefore, y 3 is a horizontal asymptote. Step 2 Find critical points by taking the derivative of the function. f x x 2 3 3x 1 6 2 2 x 2 x 2 Set the derivative equal to zero and solve for x: 6 x 2 2 0 There are no values of x for which the derivative is zero. Because the numerator is 6 and the denominator is squared, the derivative will always be positive (the curve is always rising). You should note that the derivative is undefined at x 2 , but you already know that there’s an asymptote at x 2 , so you don’t need to examine this point further. Step 3 Now take the second derivative to find any points of inflection. Use f x x 2 0 6 2 x 2 2 f x x 2 2 2 12 x 2 x 2 4 12 x 2 3 Set the derivative equal to zero and solve for x: 12 x 2 3 0 Again, there are no values of x where this is zero. When x 2 , the expression is positive and so the graph is concave up. When x 2 , the expression is negative and so the graph is concave down. We can now plot the curve. 6 x 2 2 .


