Class 1
advertisement

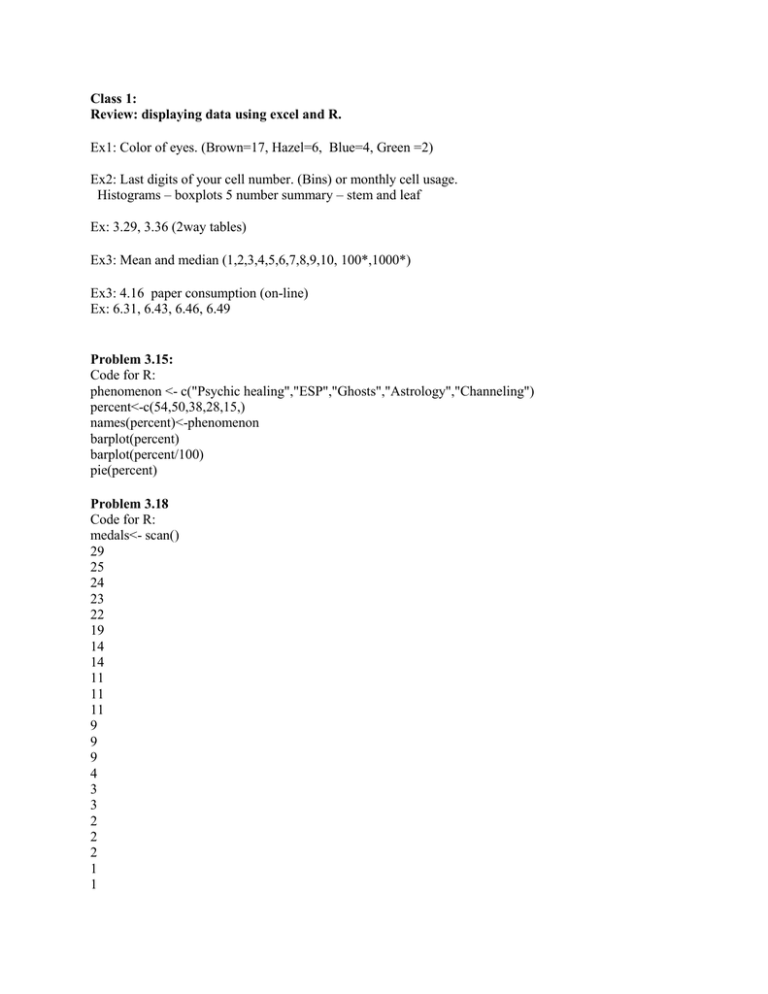
Class 1: Review: displaying data using excel and R. Ex1: Color of eyes. (Brown=17, Hazel=6, Blue=4, Green =2) Ex2: Last digits of your cell number. (Bins) or monthly cell usage. Histograms – boxplots 5 number summary – stem and leaf Ex: 3.29, 3.36 (2way tables) Ex3: Mean and median (1,2,3,4,5,6,7,8,9,10, 100*,1000*) Ex3: 4.16 paper consumption (on-line) Ex: 6.31, 6.43, 6.46, 6.49 Problem 3.15: Code for R: phenomenon <- c("Psychic healing","ESP","Ghosts","Astrology","Channeling") percent<-c(54,50,38,28,15,) names(percent)<-phenomenon barplot(percent) barplot(percent/100) pie(percent) Problem 3.18 Code for R: medals<- scan() 29 25 24 23 22 19 14 14 11 11 11 9 9 9 4 3 3 2 2 2 1 1 1 1 1 1 Read 26 items names(medals)<-c( "Germany","USA","Canada","Austria","Russia","Norway","Sweeden","Switzerland","SKorea","Italy","C hina","France","Netherlands","Findland","CzechR","Croatia","Australia","Poland","Ukraine","Japan","B elarus","Bulgaria","England","Slovakia","Latvia") What is a good way to display this data? barplot(medals) pie(medals) table(medals) counts<-table(medals) pie(counts) barplot(counts) stem(medals) hist(medals) hist(medals,probability=T) rug(jitter(medals)) boxplot(medals) summary(medals) Example with what you can do with R: count<-c(28,46,58,20,31,64,149,316,103) age<-c(2.5,7.5,13,16.5,17.5,19,22.5,44.5,70.5) age.acident<-rep(age,count) brk<-c(0,5,10,16,17,18,20,25,60,80) hist(age.acident,breaks=brk) hist(age.acident,breaks=brk,probability=T) boxplot(age.acident) ____________________________________________________________________________

