Chapter 3 Practice
advertisement
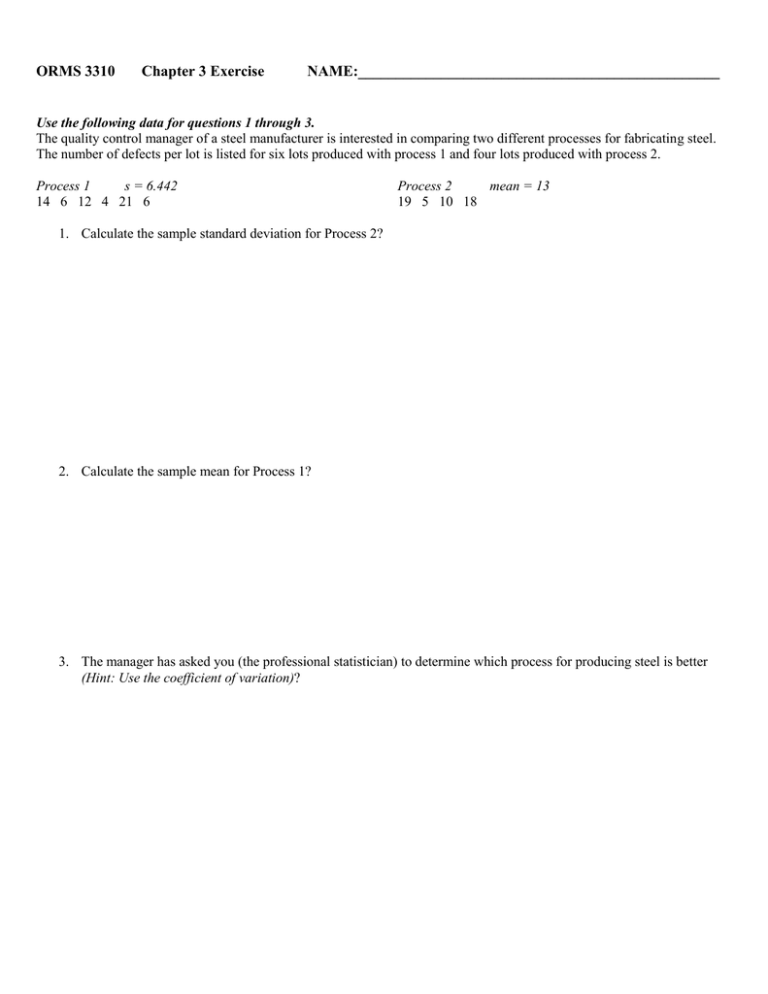
ORMS 3310 Chapter 3 Exercise NAME:________________________________________________ Use the following data for questions 1 through 3. The quality control manager of a steel manufacturer is interested in comparing two different processes for fabricating steel. The number of defects per lot is listed for six lots produced with process 1 and four lots produced with process 2. Process 1 s = 6.442 14 6 12 4 21 6 Process 2 mean = 13 19 5 10 18 1. Calculate the sample standard deviation for Process 2? 2. Calculate the sample mean for Process 1? 3. The manager has asked you (the professional statistician) to determine which process for producing steel is better (Hint: Use the coefficient of variation)? 4. The Dow Jones Travel Index reported what business travelers pay for hotel rooms per night in major U.S. Cities. The average hotel rates for 20 cities are as follows: City Atlanta Boston Chicago Cleveland Dallas Denver Detroit Houston Los Angeles Miami Rate per Night 163 177 166 126 123 120 144 173 160 192 a. Calculate the mean hotel room rate? b. Calculate the median hotel room rate? c. What is the mode? d. Calculate the first quartile? e. Calculate the third quartile? f. Calculate the 36th percentile? City Minneapolis New Orleans New York Orlando Phoenix Pittsburgh San Francisco Seattle St. Louis Washington D.C. Rate per Night 125 167 245 146 139 134 167 162 145 207 5. Cell phone users were asked how many minutes per month they use their cell phone. A sample of 15 cell phone users is shown below. 615 430 690 265 180 135 830 250 245 380 395 1180 420 210 105 a. Calculate the mean number of minutes of cell phone usage per month? b. Calculate the median number of minutes of cell phone usage per month? c. Calculate the 85th percentile? d. If the average wireless subscriber plan allows up to 750 minutes of usage per month. What do the data suggest about cell phone subscribers’ utilization of their monthly plan? 6. Car rental rates per day for a sample of seven Eastern U.S. Cities are a follows. City Boston Atlanta Miami New York Orlando Pittsburgh Washington, D.C. Daily Rate $43 35 34 58 30 30 36 a. Calculate the mean car rental rate? b. Calculate the range of the car rental rates? c. Calculate the values for the first quartile and the third quartile? d. Calculate the interquartile range? e. Calculate the variance for the car rental rates? f. Calculate the standard deviation for the car rental rates? g. Calculate the coefficient of variation for the car rental rates? h. A similar sample of seven Western U.S. Cites showed a sample mean car rental rate of $38 per day. The variance and standard deviation were 12.3 and 3.5, respectively. Discuss any difference between car rental rates in Eastern and Western U.S. Cities. 7. Consider a sample with the data values of 10, 20, 12, 17, and 16. Compute the range, interquartile range, variance, standard deviation, and the coefficient of variation. 8. A bowler’s scores for 3 games were 182, 190, and 168. Compute the range, variance, standard deviation, and the coefficient of variation. 9. Consider the sample data values of 10, 20, and 12. Compute the z-score for each of the 3 observations. 10. Consider a sample mean of 500 and a standard deviation of 100. Calculate the z-scores for the following data values: 520, 650, 500, 450, and 280? 11. The high costs in the California real estate market have caused families who cannot afford to buy bigger homes to consider backyard sheds as an alternative form of housing expansion. The mean price of a customized wooden structure is $3100. Assume that the standard deviation is $1200. a. Calculate the z-score for a backyard structure costing $2300? b. Calculate the z-score for a backyard structure costing $4900? c. Interpret the z-score in parts (a) and (b). Comment on whether either should be considered an outlier. d. A recent article describer a $13,000 shed. Should this structure be considered an outlier? ANSWERS: 1. 6.6833 2. 10.5 3. CV1 = 61.3524% CV2 = 51.4101% The process with less variation is better. Therefore process 2 is better. 4. a. 159.05 b. 161 c. 167 d. 136.5 e. 170 f. 145 5. a. 422 b. 380 c. 690 d. Using the mean of 422, cell phone subscribers are using 422/750 = 56% of the capacity of their plans. Part (c) shows that 85% of the subscribers are using 690 or less. In general, cell phone users are not coming close to using the 750 minute capacity of their plans. 6. a. 38 b. 28 c. First quartile = 30 Third quartile = 43 d. IQR = 13 e. 97 f. 9.8489 g. 25.9180% h. The mean car rental rate per day is $38 for both Eastern and Western cities. However, Eastern cities show a greater variation is rates per day. This greater variation is most likely due to the inclusion of the most expensive city (New York) in the Eastern city sample. 7. Range = 10, interquartile range = 5, variance = 16, standard deviation = 4, coefficient of variation = 26.6667% 8. Range = 22, variance = 124, 9. z-score for 10 = -0.76 standard deviation = 11.1355, z-score for 20 = 1.13 coefficient of variation = 6.1864% z-score for 12 = -0.38 10. z-score for 520 = 0.20 z-score for 650 = 1.50 z-score for 500 = 0 z-score for 450 = -0.50 z-score for 280 = -2.20 11. a. -0.67 b. 1.5 c. $2300 is 0.67 standard deviation below the mean. $4900 is 1.50 standard deviation above the mean. Neither is an outlier. d. The z-score for $13,000 is 8.25. Therefore, this cost is an outlier.

