How to writeup a lab
advertisement

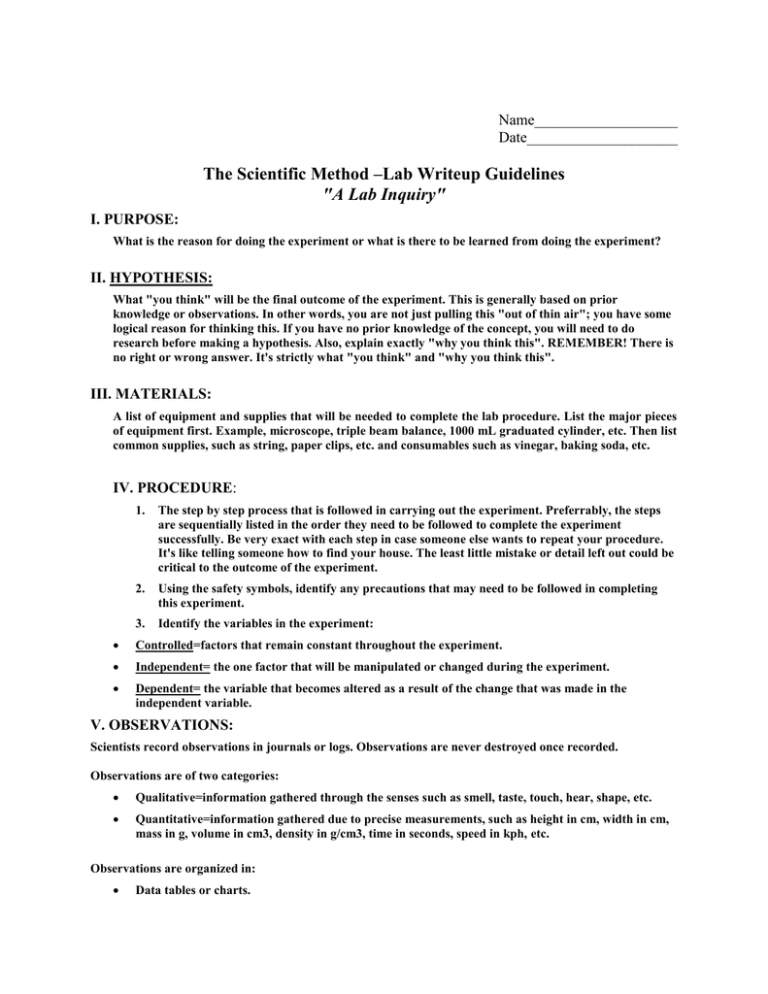
Name___________________ Date____________________ The Scientific Method –Lab Writeup Guidelines "A Lab Inquiry" I. PURPOSE: What is the reason for doing the experiment or what is there to be learned from doing the experiment? II. HYPOTHESIS: What "you think" will be the final outcome of the experiment. This is generally based on prior knowledge or observations. In other words, you are not just pulling this "out of thin air"; you have some logical reason for thinking this. If you have no prior knowledge of the concept, you will need to do research before making a hypothesis. Also, explain exactly "why you think this". REMEMBER! There is no right or wrong answer. It's strictly what "you think" and "why you think this". III. MATERIALS: A list of equipment and supplies that will be needed to complete the lab procedure. List the major pieces of equipment first. Example, microscope, triple beam balance, 1000 mL graduated cylinder, etc. Then list common supplies, such as string, paper clips, etc. and consumables such as vinegar, baking soda, etc. IV. PROCEDURE: 1. The step by step process that is followed in carrying out the experiment. Preferrably, the steps are sequentially listed in the order they need to be followed to complete the experiment successfully. Be very exact with each step in case someone else wants to repeat your procedure. It's like telling someone how to find your house. The least little mistake or detail left out could be critical to the outcome of the experiment. 2. Using the safety symbols, identify any precautions that may need to be followed in completing this experiment. 3. Identify the variables in the experiment: Controlled=factors that remain constant throughout the experiment. Independent= the one factor that will be manipulated or changed during the experiment. Dependent= the variable that becomes altered as a result of the change that was made in the independent variable. V. OBSERVATIONS: Scientists record observations in journals or logs. Observations are never destroyed once recorded. Observations are of two categories: Qualitative=information gathered through the senses such as smell, taste, touch, hear, shape, etc. Quantitative=information gathered due to precise measurements, such as height in cm, width in cm, mass in g, volume in cm3, density in g/cm3, time in seconds, speed in kph, etc. Observations are organized in: Data tables or charts. Graphs are visual representations of the data so that it can be easily studied, interpreted, and analyzed. Circle, bar, and line are examples of kinds of graphs. VI. CONCLUSION: This is a written summary of what was actually learned from doing the experiment. The conclusion will either support or reject the proposed hypothesis. The following is a three paragraph format to follow in writing an appropriate conclusion. The outline is a guide to help you include the necessary information. Adhere to ALL writing rules in completing this conclusion. Treat it as though you were writing a three paragraph essay in your English class. Elaboration is ALWAYS the key! INCLUDE THESE "ESSENTIAL ELEMENTS" IN WRITING EACH PARAGRAPH: 1. Paragraph One: (INTRODUCTION/BACKGROUND/ABSTRACT) Write and abstract of your experiment in 200 words or less. This includes an introduction to the purpose of this experiment/hypothesis, a brief explanation of the procedure conducted, overall results of your investigation and future implications. (Follow guidelines for writing abstracts OJAS) Discuss and explain the relevance of any new terms that were relevant to understanding and conducting the investigation and cite any articles you have read as a background to the topic of this experiment. 2. Paragraph Two: (EXPERIMENTAL PROCEDURE) Restate your hypothesis and your reasoning for this prediction. Address the experimental design and any flaws/changes to be made . Discuss the control setup/variables(i.e. independent/dependent) and constants in your investigation. Describe safety precautions. 3. Paragraph Three (RESULTS and ANALYSIS) Describe the outcome of the experiment and how it relates to your hypothesis (supports or rejects). Refer to your data tables, graphs, etc. in assessing the data because actual data from your observations is a "must" in forming a conclusion and explaining your results. BE VERY SPECIFIC using examples from your data to explain your results. From your analysis, point out certain trends or patterns that support your conclusion. In conclusion, explain exactly what was/was not accomplished or learned from doing the lab. Give a detailed description of how you were able to determine the above. Were there any hidden variables that may have affected the reliability of the data ... explain? What suggestions could you make to improve the reliability of the data? How relevant or useful was this lab in your understanding of the current topic or concept. Where can we go from here? (Extension suggestions? Scoring Guide Purpose & Materials & Data Table Graph Hypotheses Procedure 15 pts. 15 pts. 20 pts. 20 pts. Conclusion 30 pts. Total Points 100


