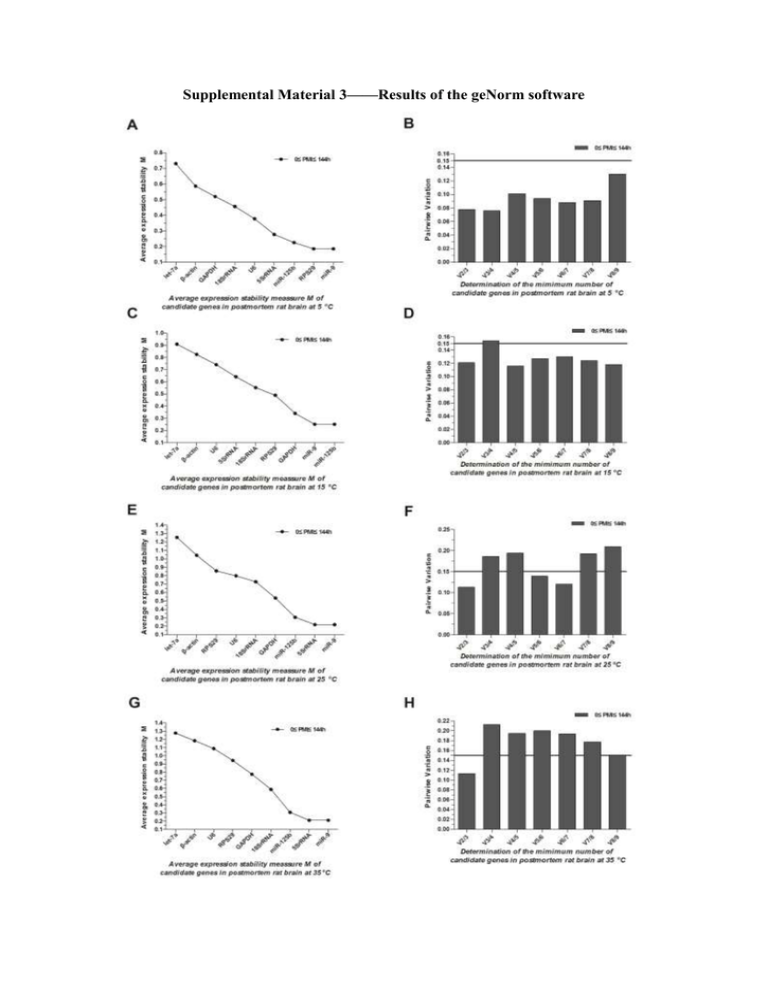
Supplemental Material 3——Results of the geNorm software
advertisement

Supplemental Material 3——Results of the geNorm software Choosing of reference markers 1. Methods The geNorm software for processing RT-qPCR data was used in our study to identify the most stable reference markers and the optimum number of markers needed for reliable data normalization in animal and human tissues. geNorm calculates the gene expression stability measure, M, and the average pairwise variation, V. Markers are ranked by the M value. Reference markers with lower M values are more stably expressed, and the M values of target markers are higher than those of reference markers (Vandesompele and De Preter et al., 2002). The pairwise variation Vn/n+1 (n≥2, where n is the number of candidate reference markers) was calculated based on normalization factor values according to the geNorm manual (http://medgen.ugent.be/~jvdesomp/genorm/geNorm_manual.pdf). The number (n or (n+1)) of reference markers is suitable when Vn/n+1 is less than 0.15. All biomarkers were analyzed in rat samples and reference biomarkers were designated according to the criteria described above. 2. Result GeNorm results shows that V2/3 are less than 0.15 in all investigated groups, indicating that 2 or 3 reference markers are needed to be chosen at the same time. Meanwhile miR-125b and miR-9 were found to be suitable when choosing 2 or 3 reference markers in all the groups because they have the minimum M value. So we choose miR-125b and miR-9 to be control markers at the same time in this research. References: Vandesompele, J. and K. De Preter, et al. (2002). "Accurate normalization of real-time quantitative RT-PCR data by geometric averaging of multiple internal control genes." Genome Biol 3 (7): RESEARCH0034.


