Additional file 4 Community associated MRSA Hospital associated MRSA
advertisement
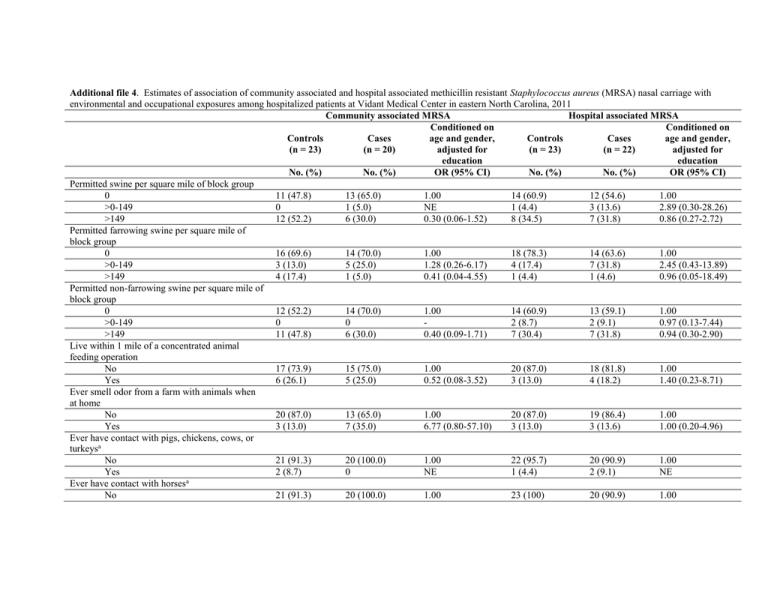
Additional file 4. Estimates of association of community associated and hospital associated methicillin resistant Staphylococcus aureus (MRSA) nasal carriage with environmental and occupational exposures among hospitalized patients at Vidant Medical Center in eastern North Carolina, 2011 Community associated MRSA Hospital associated MRSA Conditioned on Conditioned on Controls Cases age and gender, Controls Cases age and gender, (n = 23) (n = 20) adjusted for (n = 23) (n = 22) adjusted for education education No. (%) No. (%) OR (95% CI) No. (%) No. (%) OR (95% CI) Permitted swine per square mile of block group 0 11 (47.8) 13 (65.0) 1.00 14 (60.9) 12 (54.6) 1.00 >0-149 0 1 (5.0) NE 1 (4.4) 3 (13.6) 2.89 (0.30-28.26) >149 12 (52.2) 6 (30.0) 0.30 (0.06-1.52) 8 (34.5) 7 (31.8) 0.86 (0.27-2.72) Permitted farrowing swine per square mile of block group 0 16 (69.6) 14 (70.0) 1.00 18 (78.3) 14 (63.6) 1.00 >0-149 3 (13.0) 5 (25.0) 1.28 (0.26-6.17) 4 (17.4) 7 (31.8) 2.45 (0.43-13.89) >149 4 (17.4) 1 (5.0) 0.41 (0.04-4.55) 1 (4.4) 1 (4.6) 0.96 (0.05-18.49) Permitted non-farrowing swine per square mile of block group 0 12 (52.2) 14 (70.0) 1.00 14 (60.9) 13 (59.1) 1.00 >0-149 0 0 2 (8.7) 2 (9.1) 0.97 (0.13-7.44) >149 11 (47.8) 6 (30.0) 0.40 (0.09-1.71) 7 (30.4) 7 (31.8) 0.94 (0.30-2.90) Live within 1 mile of a concentrated animal feeding operation No 17 (73.9) 15 (75.0) 1.00 20 (87.0) 18 (81.8) 1.00 Yes 6 (26.1) 5 (25.0) 0.52 (0.08-3.52) 3 (13.0) 4 (18.2) 1.40 (0.23-8.71) Ever smell odor from a farm with animals when at home No 20 (87.0) 13 (65.0) 1.00 20 (87.0) 19 (86.4) 1.00 Yes 3 (13.0) 7 (35.0) 6.77 (0.80-57.10) 3 (13.0) 3 (13.6) 1.00 (0.20-4.96) Ever have contact with pigs, chickens, cows, or turkeysa No 21 (91.3) 20 (100.0) 1.00 22 (95.7) 20 (90.9) 1.00 Yes 2 (8.7) 0 NE 1 (4.4) 2 (9.1) NE Ever have contact with horsesa No 21 (91.3) 20 (100.0) 1.00 23 (100) 20 (90.9) 1.00 Yes 2 (8.7) 0 NE 0 2 (9.1) NE Contact with uncooked meat products at work or at homea No 5 (21.7) 10 (50.0) 1.00 7 (30.4) 6 (27.3) 1.00 Yes 18 (78.3) 10 (50.0) 0.11 (0.01-0.97) 15 (68.2) 16 (76.2) 1.13 (0.34-3.74) Current member of the work-forceb No 11 (47.8) 15 (75.0) 1.00 15 (65.2) 13 (59.1) 1.00 Yes 12 (52.2) 5 (25.0) 0.44 (0.14-1.44) 8 (34.8) 9 (40.9) 1.41 (0.35-5.68) Household members present No 4 (17.4) 3 (15.0) 1.00 4 (17.4) 3 (13.6) 1.00 Yes 19 (82.6) 17 (85.0) 1.49 (0.22-9.92) 19 (82.6) 19 (86.4) 1.31 (0.28-6.19) Live in a rural areac No 7 (30.4) 12 (60.0) 1.00 13 (56.5) 11 (50.0) 1.00 Yes 16 (69.6) 8 (40.0) 0.23 (0.05-1.09) 10 (45.5) 11 (50.0) 1.21 (0.35-4.16) Human population density in block group of 780.9 (1810.3) 1325.1 (1746.5) 1.20 (0.83-1.74) 1145.1 (1375.2) 697.5 (944.2) 0.76 (0.46-1.25) residence,d mean (std) Abbreviations: odds ratio, OR; confidence interval, CI; NE, non-estimable a Exposed category includes participants who reported direct contact outside of work and/or indirect contact at work; no participant reported direct contact at work. b Defined as working within the 2 weeks preceding the current hospital admission. c Defined based on address and using 2010 United States Census Bureau definition of rural and urban areas, with urban areas and clusters combined into a single category. d Defined as population/square mile in census block group of residence. Entered into the model as a linear term, and the estimate represents the odds ratio for every increase in 1,000 people/square mile.
