Bird Species in Solomon Islands
advertisement

Bird Species in Solomon Islands
A study looked at the relationship between:
S = # of Species living near sea-level on the individual islands of Solomon archipelago
A = Area in miles2
D = Distance from center of archipelago in miles (many have 0 for value)
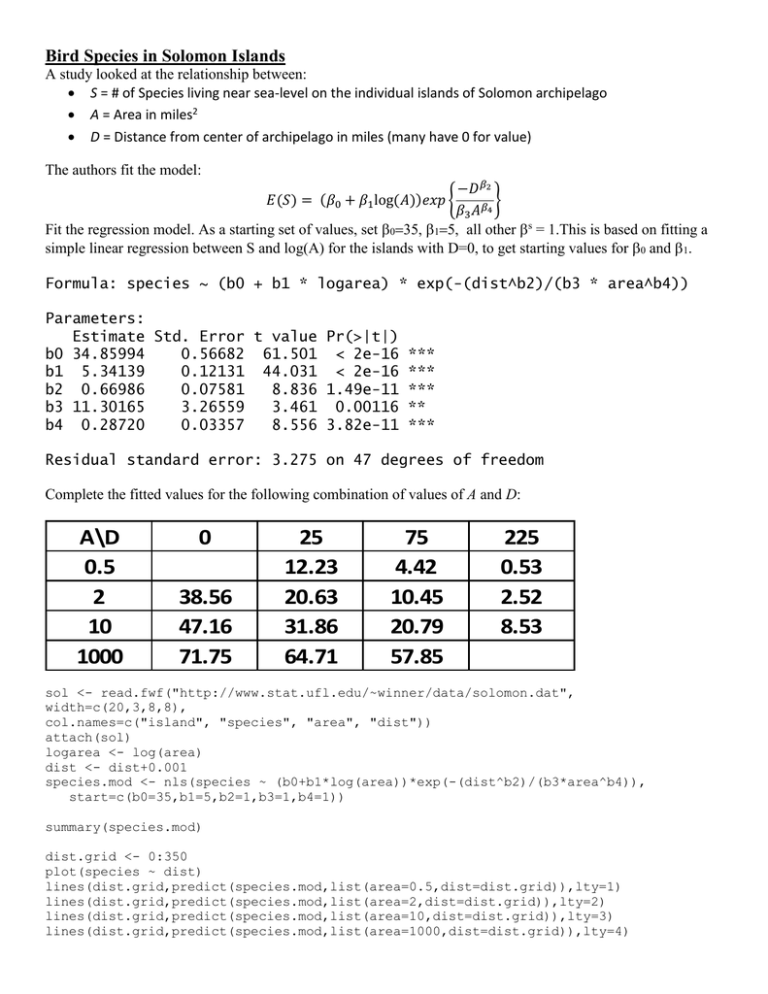
The authors fit the model:
−𝐷𝛽2
}
𝛽3 𝐴𝛽4
Fit the regression model. As a starting set of values, set all other s = 1.This is based on fitting a
simple linear regression between S and log(A) for the islands with D=0, to get starting values for and .
𝐸(𝑆) = (𝛽0 + 𝛽1 log(𝐴))𝑒𝑥𝑝 {
Formula: species ~ (b0 + b1 * logarea) * exp(-(dist^b2)/(b3 * area^b4))
Parameters:
Estimate Std. Error t value Pr(>|t|)
b0 34.85994
0.56682 61.501 < 2e-16
b1 5.34139
0.12131 44.031 < 2e-16
b2 0.66986
0.07581
8.836 1.49e-11
b3 11.30165
3.26559
3.461 0.00116
b4 0.28720
0.03357
8.556 3.82e-11
***
***
***
**
***
Residual standard error: 3.275 on 47 degrees of freedom
Complete the fitted values for the following combination of values of A and D:
A\D
0.5
2
10
1000
0
38.56
47.16
71.75
25
12.23
20.63
31.86
64.71
75
4.42
10.45
20.79
57.85
225
0.53
2.52
8.53
sol <- read.fwf("http://www.stat.ufl.edu/~winner/data/solomon.dat",
width=c(20,3,8,8),
col.names=c("island", "species", "area", "dist"))
attach(sol)
logarea <- log(area)
dist <- dist+0.001
species.mod <- nls(species ~ (b0+b1*log(area))*exp(-(dist^b2)/(b3*area^b4)),
start=c(b0=35,b1=5,b2=1,b3=1,b4=1))
summary(species.mod)
dist.grid <- 0:350
plot(species ~ dist)
lines(dist.grid,predict(species.mod,list(area=0.5,dist=dist.grid)),lty=1)
lines(dist.grid,predict(species.mod,list(area=2,dist=dist.grid)),lty=2)
lines(dist.grid,predict(species.mod,list(area=10,dist=dist.grid)),lty=3)
lines(dist.grid,predict(species.mod,list(area=1000,dist=dist.grid)),lty=4)


