Exam 2 - Fall 2005
advertisement

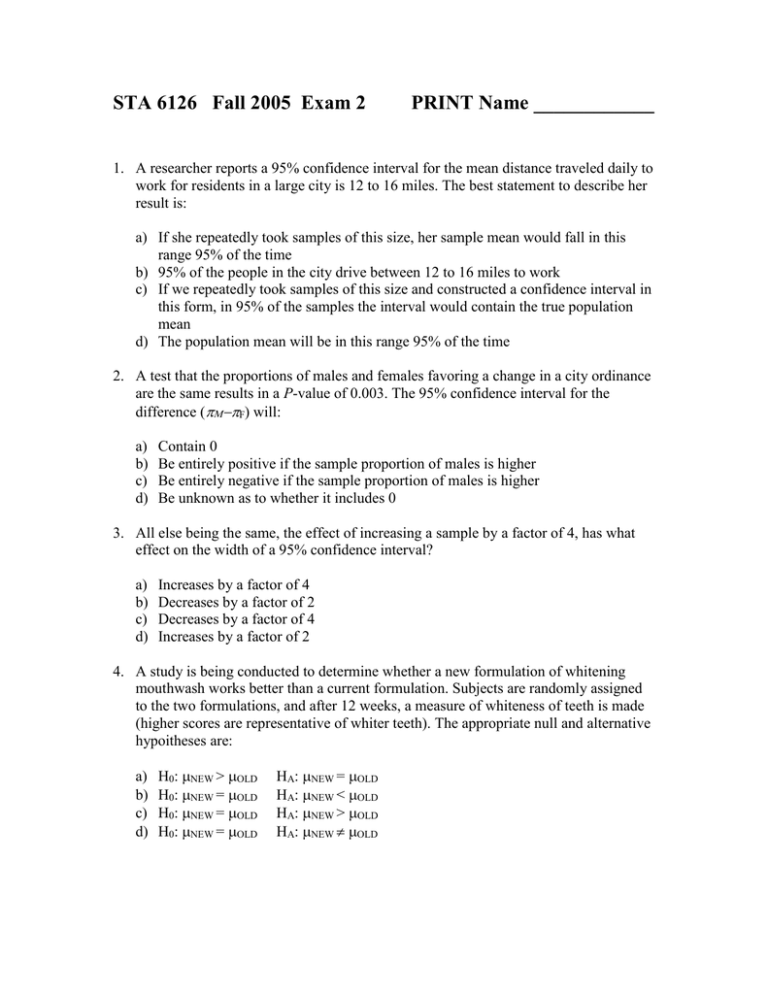
STA 6126 Fall 2005 Exam 2 PRINT Name ____________ 1. A researcher reports a 95% confidence interval for the mean distance traveled daily to work for residents in a large city is 12 to 16 miles. The best statement to describe her result is: a) If she repeatedly took samples of this size, her sample mean would fall in this range 95% of the time b) 95% of the people in the city drive between 12 to 16 miles to work c) If we repeatedly took samples of this size and constructed a confidence interval in this form, in 95% of the samples the interval would contain the true population mean d) The population mean will be in this range 95% of the time 2. A test that the proportions of males and females favoring a change in a city ordinance are the same results in a P-value of 0.003. The 95% confidence interval for the difference (F) will: a) b) c) d) Contain 0 Be entirely positive if the sample proportion of males is higher Be entirely negative if the sample proportion of males is higher Be unknown as to whether it includes 0 3. All else being the same, the effect of increasing a sample by a factor of 4, has what effect on the width of a 95% confidence interval? a) b) c) d) Increases by a factor of 4 Decreases by a factor of 2 Decreases by a factor of 4 Increases by a factor of 2 4. A study is being conducted to determine whether a new formulation of whitening mouthwash works better than a current formulation. Subjects are randomly assigned to the two formulations, and after 12 weeks, a measure of whiteness of teeth is made (higher scores are representative of whiter teeth). The appropriate null and alternative hypoitheses are: a) b) c) d) H0: NEW > OLD H0: NEW = OLD H0: NEW = OLD H0: NEW = OLD HA: NEW = OLD HA: NEW < OLD HA: NEW > OLD HA: NEW OLD 5. You would like to estimate the proportion of adults in a city who favor the building of a new superstore within 0.02 (2%). How large of a random sample would you need to be 95% confident that your estimate will be within 0.02 of the proportion of all adults in the city who favor the building of the superstore. Problem 6 not covered yet (technically) 6. A study is conducted to observe whether a method of teaching drawing improves people’s drawings. A sample of 5 individuals is obtained, and each is asked to draw an image before and after the training session. Their drawings are rated by a team of evaluators who are unaware of whether the drawings were done before or after the session (their rating scale ranges from 0 to 25). The scores are given below: Student Alex Chris Sandy Sam Dana Before 14 8 13 17 14 a) Obtain the mean and standard deviation of the differences (Before-After) b) Compute a 95% Confidence Interval for the true mean difference. After 19 14 17 23 18 7. A clinical trial comparing two antidepressants has 1000 patients receiving each drug (independent samples). Of those receiving Drug A, 640 show a distinct level of improvement. Of those receiving Drug B, 560 show this level of improvement, Test whether the improvement rates of the two drugs differ by completing the following parts: a) Null Hypothesis: b) Alternative Hypothesis: c) Test Statistic: d) P-value: e) If you use an =0.05 significance level, what will you conclude? i. ii. iii. Drug A has higher improvement rate Drug B has higher improvement rate Cannot conclude the improvement rares differ 8. A random sample of 16 households in a rural village in an underdeveloped country yields a mean weekly income of $15 and a standard deviation of $4. Assuming incomes are approximately normally distributed, give a 95% confidence interval for the mean income of all households in the village. 9. A study was conducted to determine the effect of priests administering a test of religious attitudes versus teachers. Independent random samples of children in parochial schools were administered the tests (100 by priests, 100 by teachers). The following table gives the results. Test whether there is a priest (versus teacher) effect on scores. That is, test whether the true population mean is higher for priests. Mean Std Dev Sample Size a) Null Hypothesis: b) Alternative Hypotheis: c) Test Statistic: d) P-value: Priests 20.0 5.0 100 Teachers 18.5 6.0 100


