Project 4 - Due 12/05/11
advertisement

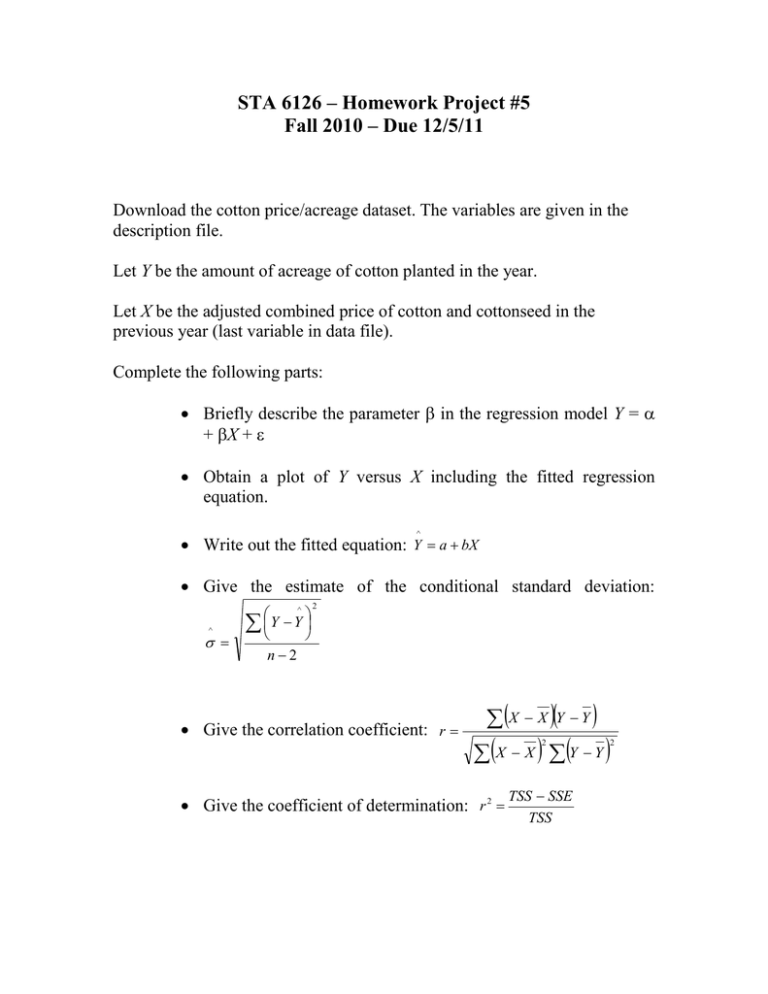
STA 6126 – Homework Project #5 Fall 2010 – Due 12/5/11 Download the cotton price/acreage dataset. The variables are given in the description file. Let Y be the amount of acreage of cotton planted in the year. Let X be the adjusted combined price of cotton and cottonseed in the previous year (last variable in data file). Complete the following parts: Briefly describe the parameter in the regression model Y = + X + Obtain a plot of Y versus X including the fitted regression equation. ^ Write out the fitted equation: Y a bX Give the estimate of the conditional standard deviation: ^ ^ Y Y n2 2 Give the correlation coefficient: r X X Y Y X X Y Y Give the coefficient of determination: r 2 2 TSS SSE TSS 2 Conduct the t-test to test H0: =0 vs HA: ≠0 based on the 0.05 significance level. Obtain a 95% confidence interval for Give the Analysis of Variance Table. Conduct the F-test to test H0: =0 vs HA: ≠0 based on the 0.05 significance level. Conduct the t-test to test H0: =0 vs HA: ≠0 based on the 0.05 significance level. SPSS Instructions: Import dataset into SPSS Using Variable View, Name the relevant variables (e.g. acres, price) Make sure both variables are SCALE in the last column Return to Data View and Select: GRAPHS (To obtain Plot with Fitted Equation) INTERACTIVE (This may not be available on newer versions) SCATTERPLOT Move acres to vertical (up/down) axis Move price to horizontal (right/left) axis Click on Fit tab Select Regression as Method ANALYZE (To fit Model) REGRESSION LINEAR Identify acres as Dependent Variable Identify price as Independent Variable Under STATISTICS, select Confidence Intervals


