Supplementary Appendix 1 Contents
advertisement

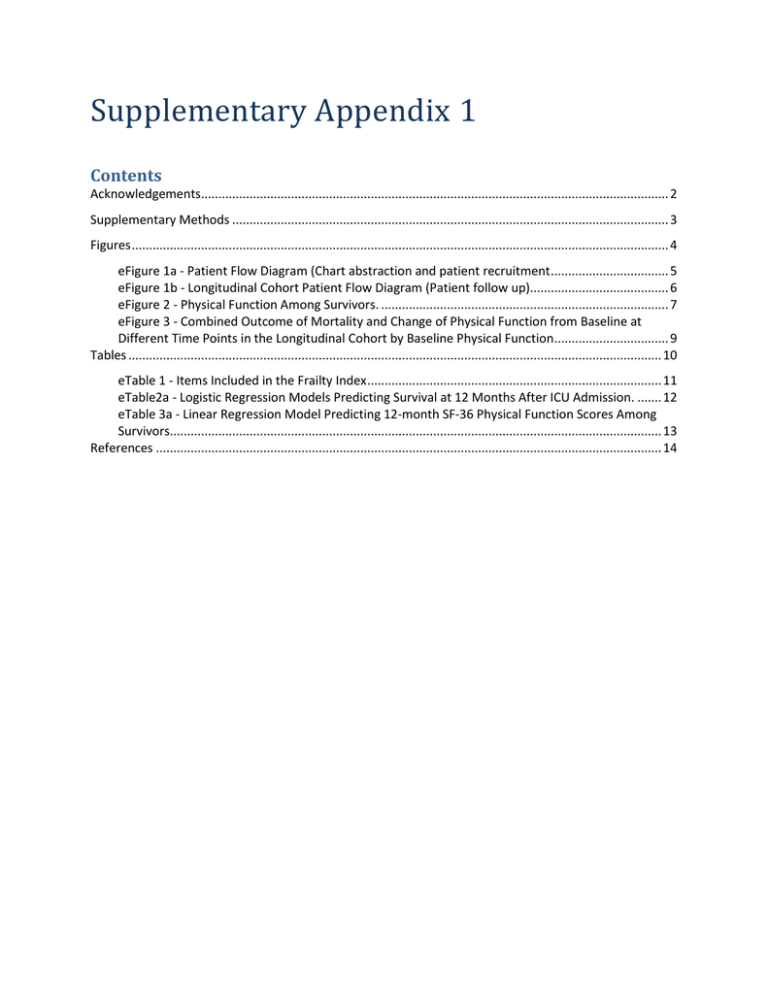
Supplementary Appendix 1 Contents Acknowledgements....................................................................................................................................... 2 Supplementary Methods .............................................................................................................................. 3 Figures ........................................................................................................................................................... 4 eFigure 1a - Patient Flow Diagram (Chart abstraction and patient recruitment .................................. 5 eFigure 1b - Longitudinal Cohort Patient Flow Diagram (Patient follow up)........................................ 6 eFigure 2 - Physical Function Among Survivors. ................................................................................... 7 eFigure 3 - Combined Outcome of Mortality and Change of Physical Function from Baseline at Different Time Points in the Longitudinal Cohort by Baseline Physical Function ................................. 9 Tables .......................................................................................................................................................... 10 eTable 1 - Items Included in the Frailty Index ..................................................................................... 11 eTable2a - Logistic Regression Models Predicting Survival at 12 Months After ICU Admission. ....... 12 eTable 3a - Linear Regression Model Predicting 12-month SF-36 Physical Function Scores Among Survivors.............................................................................................................................................. 13 References .................................................................................................................................................. 14 Acknowledgements We would like to thank Jennifer Korol and other staff at the Clinical Evaluation Research Unit at the Kingston General Hospital for their role in coordinating the study. We would also like to thank the following colleagues who participated in data collection for this study (number in brackets refers to number of patients enrolled at each site): Hôpital du Sacré-Coeur de Montréal (71), Montréal, Québec: Martin Albert, Patrice Deroy, Caroline Chagnon, Huber Simard. Hôpital de L’Enfant-Jésus (50), Québec City, Québec: Alexis Turgeon, Chantal Gagné, Marie Thibodeau, Suzy Lavoie, Michèle D’Amours Hôpital Laval (50), Québec City, Québec: Francois Lellouche, Marie-Claude Ferland, Patrick Dussault. Royal University Hospital (49), Saskatoon, Saskatchewan: John Reid, Rose Rumanski, Susan Hattori University of Alberta Hospital (48), Edmonton, Alberta : Sean Bagshaw; Karen O’Hara Banack; Nadia Baig; Sheri Cholin, Samantha Taylor St. Paul’s Hospital (46), Vancouver, British Columbia: Peter Dodek, Betty Jean Ashley. Kingston General Hospital (39), Kingston, Ontario: John Muscedere, Susan Fleury, Nicole O’Callaghan. Ottawa Hospital, Civic Campus (32), Ottawa, Ontario: Richard Hodder, Mary Jo Lewis, Erin Murphy, Tracy McCardle Royal Alexandra Hospital (31), Edmonton, Alberta: Jim Kutsogiannis, Patrica Thompson, Kirby Scott, Reagan Bartel, Darlene Jossy Foothills Hospital (29), Calgary, Alberta: Tom Stelfox, Stephanie Todd, Crystal Wilson, Jamie Boyd St. Boniface Hospital Winnipeg (29), Winnipeg, Manitoba: Allan Garland, Kim Wiebe, Nicole Martens, Wellam Yu Ko Hôpital Maisonneuve-Rosemont (24), Montréal, Québec: Stéphane Ahern, Johanne Harvey, Brigitte Beauregard Mount Sinai Hospital (19), Toronto, Ontario: Sangeeta Mehta, Maedean Brown, Scott Kim, Alex Day. Royal Columbian (17), New Westminster, BC: Sean Keenan, Miroslav Svetik, Jacquie Stevenson Sunnybrook Health Sciences Centre (17), Toronto, Ontario: Rob Fowler, Nicole Marinoff, Derek Parsotam, Ashwati Raghunath St. Michael’s Hospital MSICU/NTICU (14/0), Toronto, Ontario: Karen Burns, Orla Smith, Yoon Lee, Kerri Porretta, Julia Lee, Marlene Santos Peter Lougheed Hospital (11), Calgary, Alberta: Tom Stelfox, Cheryl Dielissen, Stephanie Todd Toronto General Hospital (11), Toronto, Ontario: Neil Lazar; Paulina Farias, Andrea Matte, Emily Stern St. Joseph’s Healthcare (11), Hamilton, Ontario: Deborah Cook, Ellen McDonald, France Clarke, Nicole Zytaruk, Christina Maria Katsios Victoria General Hospital (5), Victoria, British Columbia: Gordon Wood, Fiona Auld, Leslie Atkins, Peggy Leonard Royal Jubilee Hospital (5), Victoria, British Columbia: Gordon Wood, Fiona Auld, Leslie Atkins, Peggy Leonard Winnipeg Health Sciences Centre (2), Winnipeg, Manitoba: Allan Garland, Wendy Janz, Mandi Siddiqui. Supplementary Methods From proxy responses to the comprehensive geriatric assessment, we calculated the Frailty Index. The Frailty Index identified 43 deficits at baseline (Appendix eTable 1), each coded as 0 (absent), 1 (present), or 0·5 (where intermediate values were possible).1 The score was calculated as the cumulative proportion of deficits present (minimum score 0; maximum score 1·0). The score was considered a continuous variable for modeling but was then graded as fit (> 0 and ≤ 0·2), mild frailty (> 0·2 and < 0·4) or moderate/severe frailty (≥ 0·4) for descriptive purposes.2 At baseline, we also recorded patients’ baseline physical function (see Short Form-36 (SF-36) details below), and the Informant Questionnaire on Cognitive Decline in the Elderly (IQCODE) using proxy responses from family members. The IQCODE, an unweighted average of 16 items, identifies changes in patients’ cognitive performance; this instrument has high reliability and good validity.3-5 A score > 3 indicates that some cognitive decline has occurred.3 In both the hospital and longitudinal cohorts, variables collected from hospital records at the time of ICU admission were age, sex, admission diagnosis, admission type (medical vs. surgical), Acute Physiology and Chronic Health Evaluation (APACHE) II score6, Functional Comorbidity Index7, and Charlson Comorbidity Index.8 We also measured multiple organ dysfunction using sequential organ failure assessment (SOFA) scores at admission and daily in ICU.9 All patients were followed prospectively to document duration of mechanical ventilation, and ICU and hospital lengths of stay. Figures 4 eFigure 1a - Patient Flow Diagram (Chart abstraction and patient recruitment) All consecutive patients > 80 years old were assessed for eligibility (n = 3064) Patient already in longitudinal cohort (n=610) Site already met chart abstraction quota (n=1393) Not eligible for follow-up (n=1405) 614 ICU stay< 24 hours 420 Family caregiver did not visit the patient within 96 hours of ICU admission 258 Patient acutely dying 86 Family caregiver does not speak English or French 17 Family caregiver is paid to provide care 8 Patient is not a resident of Canada 2 Family caregiver < 18 yrs old Eligible for follow-up (n=1659) Consecutive hospital chart abstractions (n=1061) Patient in ICU<24 hours (n=167) Hospital only cohort (n=894) Eligible but excluded from follow-up (n=1049) 474 Missed the caregiver 464 Caregiver refused consent 44 Family dynamics precluded consent 67 Other Longitudinal cohort (n =610) 5 eFigure 1b - Longitudinal Cohort Patient Flow Diagram (Patient follow up) Longitudinal cohort (n =610) Death or drop out in hospital (n=164) 85 died in ICU 73 died in hospital after ICU discharge 6 withdrew consent Any quarterly follow-up data (n =446) 3-month follow-up* 322-Completed follow-up 198-Died 90-Missing 6-month follow-up* 281-Completed follow-up 228-Died 101-Missing 9-month follow-up* 241-Completed follow-up 243-Died 126-Missing 12-month follow up* 254-Completed follow-up 253-Died 103-Missing **Patients with known primary outcome at one year (n =505) Legend: ICU-Intensive Care Unit. *89% reported by family members at month 3; 88% reported by family members at month 6; 87% reported by family members at month 9 and 87% reported by family members at month 12. ** Two patients with 12 month follow-up could not be evaluated for PF recovery due to a missing baseline value. 6 eFigure 2 - Physical Function Among Survivors. Panel A: SF-36 Physical Functioning Domain 7 Panel B: SF-36 Physical Component Score Legend: The average age-sex matched Canadian norms are depicted by the red dotted line. The differences between values for the patients and Canadian norms are statistically significant (at <0.05 level) at all time points (month 3, 6, 9 and 12) and this applies to both PF and PCS. 8 eFigure 3 - Combined Outcome of Mortality and Change of Physical Function from Baseline at Different Time Points in the Longitudinal Cohort by Baseline Physical Function Panel A: Patients with baseline PF<40 Deceased Alive with PF score<10 Alive with PF>=10 but 10 or more points below baseline Alive with PF>=10 and not 10 or more points below baseline n=263 n=278 50 70 90 n=282 0 10 30 Proportion of patients n=277 3 months 6 months 9 months 12 months Panel B: Patients with baseline PF≥40 Deceased Alive with PF score<10 Alive with PF>=10 but 10 or more points below baseline Alive with PF>=10 and not 10 or more points below baseline n=217 n=227 30 50 70 90 n=226 0 10 Proportion of patients n=242 3 months 6 months 9 months 12 months 9 Tables 10 eTable 1 - Items Included in the Frailty Index # Items contributed to the FI 1 2 3 4 5 6 7 8 9 10 11 12 13 14 15 16 17 18 19 20 21 22 23 24 25 26 27 28 29 30 31 32 33 34 35 36 37 38 39 40 41 42 43 Overall health of the patient? Do you think the patient was depressed? Do you think the patient worried a lot or got anxious? Do you think the patient felt exhausted or tired all the time? Did the patient have sleep problems? Did the patient have problems with memory or thinking? Did the patient have any problems speaking to make him/herself understood? Did the patient have difficulty hearing? Did the patient have problems with eyesight? (even when wearing glasses) Did the patient having problems with balance? Did the patient complain of feeling dizzy or lightheaded? Did the patient need assistance of a person or aid to prevent falling? Did the patient hold on to furniture to keep from failing? Was the patient able to walk alone? Was the patient able to get out of a bed or chair alone? Did the patient have problems with bowel control? Did the patient have problems with bladder control? Did the patient experience any unplanned weight loss in the last 6 months? What was the patient’s food intake in the week prior to ICU admission? Was the patient able to carry out some day to day tasks? Feed himself/herself? Take a bath or shower? Dress himself/herself? Drive? Look after his/her own medications? Do day-to-day shopping? Do day-to-day household cleaning? Cook well enough to maintain his/her nutrition? Look after his/her own banking and financial affairs? Overall health of the patient? Myocardial infarct Congestive heart failure Peripheral vascular disease Cerebrovascular disease +/- hemiplegia Dementia Chronic pulmonary disease Connective tissue disease Ulcer disease Any liver disease Diabetes Moderate or several renal diseases Diabetes with end organ damage Any tumor 11 eTable2a - Logistic Regression Models Predicting Survival at 12 Months After ICU Admission. Variables Age (per 5 years) Sex (Male vs. Female) APACHE II score (per 10 points) Marital status (Married or living as married vs. Other) Baseline SOFA score (per 5 points) Admission type (Medical vs. Surgical) Surgical elective vs. Medical Surgical emergency vs. Medical Primary ICU diagnosis CABG/Valve vs. Cardiovascular/vascular Gastrointestinal vs. Cardiovascular/vascular Neurologic vs. Cardiovascular/vascular Other vs. Cardiovascular/vascular Respiratory vs. Cardiovascular/vascular Sepsis vs. Cardiovascular/vascular Stroke vs. Cardiovascular/vascular Trauma vs. Cardiovascular/vascular Baseline PF score (per 50 points) Charlson Comorbidity Index (per 2 units) IQCODE at baseline (per 0.5 point) Frailty Index (per 0.2 point) Family preferences for life sustaining treatment Comforts measures vs. other **Total model degrees of freedom/deaths *c-statistic Single Predictor OR (95% CI) c* 0.90 (0.74, 1.09) 0.64 (0.49, 0.84) 0.50 (0.38, 0.66) 0.89 (0.70, 1.12) 0.61 (0.48, 0.78) 0.51 0.56 0.63 0.52 0.59 0.61 P-value 0.29 0.002 <0.0001 0.32 <0.0001 <0.0001 0.62 0.61 (0.36, 1.01) 1 to 8/252 0.51 to 0.65 0.94 (0.75, 1.19) 0.63 0.68 (0.47, 0.97) 0.58 (0.42, 0.80) 1.05 (0.77, 1.43) 0.73 (0.47, 1.12) 0.03 0.001 0.74 0.15 0.39 1.35 (0.68, 2.69) 1.29 (0.76, 2.19) 4.12 (2.10, 8.10) 1.68 (1.10, 2.56) 8.75 (3.38, 22.63) 0.83 (0.44, 1.55) 2.20 (0.88, 5.52) 0.93 (0.39, 2.26) 0.83 (0.4, 1.72) 0.64 (0.36, 1.13) 1.10 (0.53, 2.28) 1.40 (0.65, 3.02) 1.55 (1.25, 1.93) 0.59 (0.49, 0.70) 0.85 (0.70, 1.03) 0.47 (0.40, 0.54) Multivariable Predictor Model OR (95% CI) P-value <0.0001 <0.0001 0.58 0.63 0.56 0.65 <0.0001 <0.0001 0.10 <0.0001 0.54 0.06 7.19 (2.71, 19.10) 0.73 (0.37, 1.42) 1.09 (0.50, 2.40) 1.19 (0.41, 3.41) 0.93 (0.39, 2.24) 0.79 (0.41, 1.52) 0.69 (0.28, 1.68) 1.04 (0.49, 2.24) 0.80 (0.56, 1.16) 0.71 (0.56, 0.91) 1.05 (0.84, 1.32) 0.53 (0.36, 0.78) 0.55 (0.33, 0.93) 20/250 0.76 0.24 0.006 0.65 0.002 0.02 The total sample size ranged from 505 in some single predictor models to 502 in the full models due to 3 patients with some missing covariates. OR-Odds ratio; CI-Confidence interval; FI-Frailty Index. The outcome of this model is survival at 12 months. OR>1 indicate favorable association. Predictors with p≤0.05 are in bold. 12 eTable 3a - Linear Regression Model Predicting 12-month SF-36 Physical Function Scores Among Survivors. Single Predictor Estimate (SE) P-value Variables Age (per 5 years) Sex (Male vs. Female) APACHE II score (per 10 points) Marital status (Married or living as married vs. Other) Baseline SOFA score (per 5 points) Admission type (Medical vs. Surgical) -5.8 (1.6) -0.2 (2.5) -9.4 (2.3) 6.1 (3.6) -4.1 (2.4) Surgical elective Surgical emergency Medical 30.5 (7.1) 9.6 (3.7) Referent CABG/Valve Gastrointestinal Neurologic Other Respiratory Sepsis Stroke Trauma Cardiovascular/vascular 34.9 (5.0) -2.2 (6.2) 9.8 (9.1) -8.8 (5.7) -4.4 (6.0) -5.0 (6.6) -13.8 (5.1) 1.7 (7.3) Referent 21.4 (2.4) -7.9 (1.1) -6.5 (1.7) -19.9 (1.8) -12.6 (4.8) Primary ICU diagnosis 0.002 0.93 0.0006 0.10 0.11 0.0002 Multivariable Estimate (SE) P-value -2.0 (1.5) -4.8 (2.7) -6.8 (2.6) 4.7 (3.1) -2.0 (2.6) 8.4 (6.9) 1.8 (3.9) Referent <0.0001 Baseline PF score (per 50 points) Charlson Comorbidity Index (per 2 units) IQCODE at baseline (per 0.5 point) Frailty Index (per 0.2 point) Family preferences for life sustaining treatment Comforts measures vs. Other 0.19 0.09 0.02 0.15 0.46 0.48 <0.0001 <0.0001 0.001 <0.0001 0.02 0.0007 27.6 (5.3) 0.0 (4.8) -0.2 (8.0) 0.8 (4.3) -2.7 (6.3) 1.6 (5.6) -20.3 (4.5) -2.8 (6.3) Referent 12.6 (3.2) -2.6 (1.9) -0.5 (1.0) -7.1 (3.3) -7.5 (3.6) 0.0008 0.17 0.61 0.04 0.05 SE - Standard error Predictors with p≤0.05 are in bold. 13 References 1. Pena F, Theou O, Wallace L, et al. Comparison of alternate scoring of variables on the performance of the FI. BMC Geriatr. 2014; 14:25. 2. Rockwood K, Song X, MacKnight C, et al. A global clinical measure of fitness and frailty in elderly people. CMAJ. 2005; 173:489–95. 3. Jorm AF. A short form of the Informant Questionnaire on Cognitive Decline in the Elderly: development and cross-validation. Psychol Med 1994;24:145–53. 4. Jorm AF. The Informant Questionnaire on Cognitive Decline in the Elderly (IQCODE): A review. Int Psychogeriatr 2004; 16:275–93. 5. Cherbuin N, Anstey KJ, Lipnicki DM. Screening for dementia: a review of self- and informantassessment instruments. Int Psychogeriatr 2008; 20:431–58. 6. Knaus WA, Draper EA, Wagner DP, Zimmerman JE. Apache II: a severity of diseases classification system. Crit Care Med 1985; 13:818–29. 7. Groll DL, To T, Bombardier C, Wright JG. The development of a co-morbidity index with physical function as the outcome. J Clin Epidemiol 2005; 58:595–602. 8. Charlson ME, Pompei P, Ales KL, MacKenzie CR. A new method of classifying prognostic comorbidity in longitudinal studies: Development and validation. J Chronic Dis 1987; 40:373–83. 9. Moreno R, Vincent JL, Matos R, et al. The use of maximum SOFA score to quantify organ dysfunction/failure in intensive care. Results of a prospective multicenter study. Working group on Sepsis related Problems of the ESICM. Intensive Care Med 1999; 25:686–96. 14


