Phase 1 Study of Cu-DOTA-Patritumab Page 1 (Version 10.0 9-2-15)
advertisement

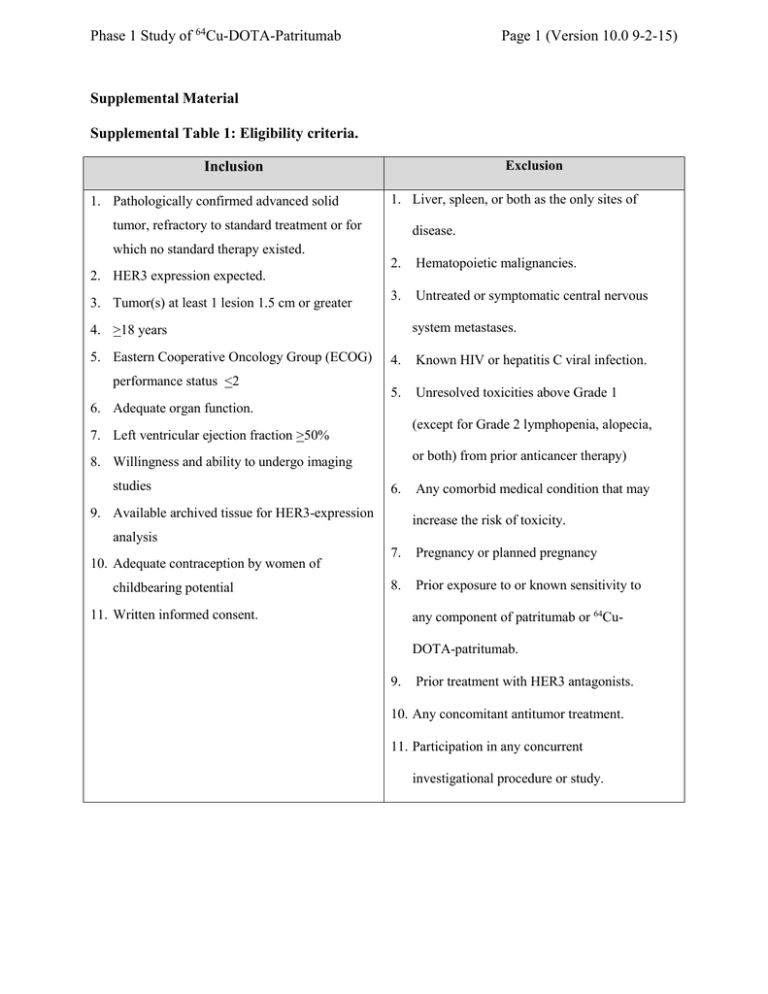
Phase 1 Study of 64Cu-DOTA-Patritumab Page 1 (Version 10.0 9-2-15) Supplemental Material Supplemental Table 1: Eligibility criteria. Exclusion Inclusion 1. Pathologically confirmed advanced solid 1. Liver, spleen, or both as the only sites of tumor, refractory to standard treatment or for disease. which no standard therapy existed. 2. Hematopoietic malignancies. 3. Untreated or symptomatic central nervous 2. HER3 expression expected. 3. Tumor(s) at least 1 lesion 1.5 cm or greater system metastases. 4. >18 years 5. Eastern Cooperative Oncology Group (ECOG) performance status <2 4. Known HIV or hepatitis C viral infection. 5. Unresolved toxicities above Grade 1 6. Adequate organ function. (except for Grade 2 lymphopenia, alopecia, 7. Left ventricular ejection fraction >50% or both) from prior anticancer therapy) 8. Willingness and ability to undergo imaging studies 6. 9. Available archived tissue for HER3-expression Any comorbid medical condition that may increase the risk of toxicity. analysis 10. Adequate contraception by women of childbearing potential 7. Pregnancy or planned pregnancy 8. Prior exposure to or known sensitivity to 11. Written informed consent. any component of patritumab or 64CuDOTA-patritumab. 9. Prior treatment with HER3 antagonists. 10. Any concomitant antitumor treatment. 11. Participation in any concurrent investigational procedure or study. Phase 1 Study of 64Cu-DOTA-Patritumab Page 2 (Version 10.0 9-2-15) Supplemental Table 2. Organ residence times in hours for all 5 dosimetry cohort subjects. Subject ID Organ/Tissue 1 2 3 4 5 Blood 9.26 7.97 8.53 9.02 8.74 Lung 0.24 0.14 0.28 0.24 0.19 Liver 12.2 8.02 8.62 11.37 8.99 Spleen 0.26 0.13 0.19 0.15 0.13 Kidney 0.28 0.28 0.36 0.27 0.32 Red marrow 0.85 0.73 0.78 0.82 0.80 Heart Content 0.57 0.49 0.53 0.56 0.54 Remainder of the body 7.84 8.53 7.57 7.64 7.37 Phase 1 Study of 64Cu-DOTA-Patritumab Page 3 (Version 10.0 9-2-15) Supplemental Table 3. Organ radiation doses (mGy/MBq) from PET/CT data. Subject ID Organ 1 2 3 4 5 Mean SD Adrenals 0.040 0.032 0.033 0.038 0.033 0.035 0.004 Brain 0.012 0.013 0.011 0.011 0.011 0.012 0.001 Breasts 0.017 0.016 0.015 0.016 0.015 0.016 0.001 Gallbladder 0.062 0.046 0.047 0.058 0.048 0.052 0.007 LLI Wall 0.015 0.016 0.014 0.015 0.014 0.015 0.001 Small Intestines 0.021 0.020 0.019 0.020 0.019 0.020 0.001 Stomach 0.024 0.021 0.020 0.022 0.020 0.022 0.001 ULI Wall 0.025 0.022 0.021 0.024 0.021 0.023 0.002 Heart Wall 0.079 0.068 0.071 0.076 0.072 0.073 0.004 Kidneys 0.097 0.091 0.113 0.092 0.102 0.099 0.009 Liver 0.58 0.38 0.41 0.54 0.42 0.46 0.086 Lungs 0.035 0.023 0.035 0.034 0.028 0.031 0.005 Muscle 0.017 0.017 0.016 0.017 0.015 0.016 0.001 Ovaries 0.017 0.017 0.016 0.016 0.016 0.016 0.001 Pancreas 0.037 0.030 0.030 0.035 0.030 0.032 0.003 Red marrow 0.046 0.040 0.041 0.044 0.042 0.043 0.002 Osteogenic cells 0.045 0.043 0.041 0.043 0.041 0.043 0.001 Skin 0.013 0.013 0.012 0.013 0.012 0.013 0.001 Spleen 0.124 0.066 0.092 0.075 0.066 0.085 0.025 Testes 0.012 0.013 0.012 0.012 0.012 0.012 0.001 Thymus 0.019 0.018 0.017 0.018 0.017 0.018 0.001 Thyroid 0.014 0.014 0.013 0.013 0.013 0.013 0.001 Urinary bladder wall 0.015 0.015 0.014 0.014 0.014 0.014 0.001 Uterus 0.017 0.017 0.015 0.016 0.015 0.016 0.001 Total Body 0.034 0.028 0.028 0.032 0.028 0.030 0.003 Effective Dose Equivalent (mSv/MBq) 0.074 0.055 0.061 0.068 0.059 0.063 0.008 Effective Dose (mSv/MBq) 0.051 0.039 0.041 0.048 0.041 0.044 0.005 Phase 1 Study of 64Cu-DOTA-Patritumab Page 4 (Version 10.0 9-2-15) Supplemental Figure 1. Study schema for Dosimetry and Receptor Occupancy Cohorts. Phase 1 Study of 64Cu-DOTA-Patritumab Supplemental Figure 2. Patient flow diagram. Page 5 (Version 10.0 9-2-15) Phase 1 Study of 64Cu-DOTA-Patritumab Page 6 (Version 10.0 9-2-15) Supplemental Figure 3. Mean serum patritumab concentrations vs. time for Day 8 after administration of a single dose of patritumab 9 mg/kg (n=3) or 18 mg/kg (n = 7). Phase 1 Study of 64Cu-DOTA-Patritumab Page 7 (Version 10.0 9-2-15) Supplemental Figure 4a-4e. Time activity curves for patients 1 to 5 in the dosimetry cohort. a) b) c) Phase 1 Study of 64Cu-DOTA-Patritumab d) e) Page 8 (Version 10.0 9-2-15) Phase 1 Study of 64Cu-DOTA-Patritumab Page 9 (Version 10.0 9-2-15)


