MCsetComparison.ppt
advertisement

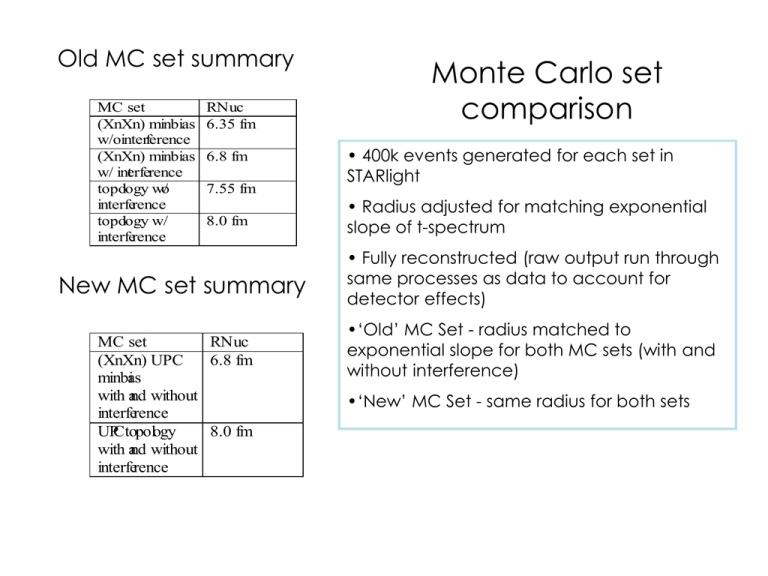
Old MC set summary MC set (XnXn) minbias w/ointerference (XnXn) minbias w/ interference topology w/o interference topology w/ interference RNuc 6.35 fm 6.8 fm 7.55 fm 8.0 fm New MC set summary MC set RNuc (XnXn) UPC 6.8 fm minbias with and without interference UPCtopology 8.0 fm with and without interference Monte Carlo set comparison • 400k events generated for each set in STARlight • Radius adjusted for matching exponential slope of t-spectrum • Fully reconstructed (raw output run through same processes as data to account for detector effects) •‘Old’ MC Set - radius matched to exponential slope for both MC sets (with and without interference) •‘New’ MC Set - same radius for both sets • 400k events generated for MinBias (XnXn) MC set in STARlight • Radius adjusted for matching exponential slope of t-spectrum • fit function = Ae-k*t • data k = 302 GeV-1 • MC k = 296 GeV -1 • fit range: 0.004 < t < 0.01 • 400k events generated for topology (0n0n) MC set in STARlight • Radius adjusted for matching exponential slope of t-spectrum • fit function = Ae-k*t • data k = 373 GeV-1 • MC k = 371 GeV -1 • fit range: 0.004 < t < 0.01 Explanation of plots: 1) Ratio of GEANT corrected Monte Carlo (STARlight) interference t-spectrum (t~pT2) to no-interference tspectrum 2) Ratio of uncorrected STARlight interference tspectrum to no-interference t-spectrum 3) Efficiency curves calculated for interference and nointerference scenarios (ratio of MC t-spectrum run through GEANT to tspectrum not run through GEANT) 4) MC interference histogram (blue), MC no-interference histogram (green), uncorrected data (red points), overall parameterization (red curve) 5) uncorrected data (red points), overall parameterization (red curve) 1 2 3 4 5 Explanation of statistics: (1) p0 - p6, fit parameters for 6th order polynomial fit to ratio (2) Same as 1 1 2 3 4 (4 &5) p0 - p2 come from overall fit: p0 = A p1 = c p2 = k 5 UPC MinBias(with nuclear excitation) or UPC topology(without nuclear excitation) = trigger dataset old UPC MinBias 0.1 < y < 0.5 new UPC MinBias 0.0 < y < 0.5 old UPC MinBias 0.1 < y < 0.5 new UPC MinBias 0.0 < y < 0.5 old UPC MinBias 0.5 < y < 1.0 new UPC MinBias 0.5 < y < 1.0 old UPC MinBias 0.5 < y < 1.0 new UPC MinBias 0.5 < y < 1.0 old UPC Topology 0.1 < y < 0.5 new UPC Topology 0.1 < y < 0.5 old UPC Topology 0.1 < y < 0.5 new UPC Topology 0.1 < y < 0.5 old UPC Topology 0.5 < y < 1.0 new UPC Topology 0.5 < y < 1.0 old UPC Topology 0.5 < y < 1.0 new UPC Topology 0.5 < y < 1.0 MC set Summary cold 2/dof cnew 2/dof 0.1 < y < 0.5 1.010.0 9 77/47 0.950.0 8 46/47 0.5 < y < 1.0 0.930.1 1 77/47 0.930.1 1 79/47 0.1 < y < 0.5 0.800.1 1 86/47 0.860.1 1 84/47 0.5 < y < 1.0 1.10.21 80/47 0.970.2 0 88/47 Minbias Topology


