Identify Slope - Teacher Notes
advertisement

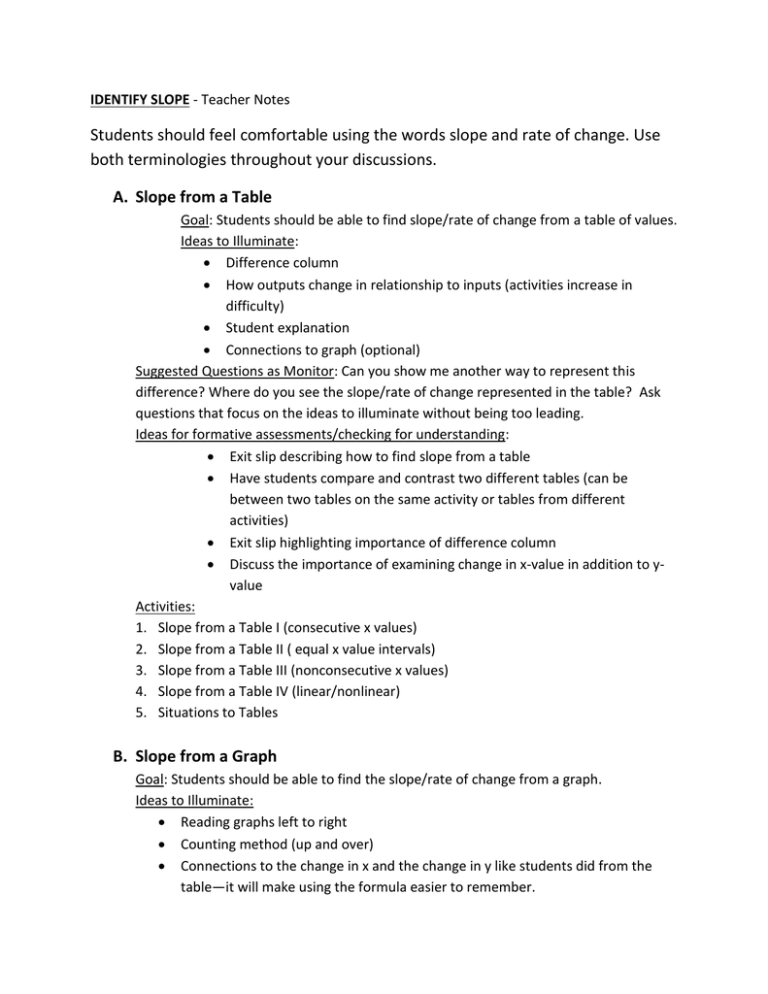
IDENTIFY SLOPE - Teacher Notes Students should feel comfortable using the words slope and rate of change. Use both terminologies throughout your discussions. A. Slope from a Table Goal: Students should be able to find slope/rate of change from a table of values. Ideas to Illuminate: Difference column How outputs change in relationship to inputs (activities increase in difficulty) Student explanation Connections to graph (optional) Suggested Questions as Monitor: Can you show me another way to represent this difference? Where do you see the slope/rate of change represented in the table? Ask questions that focus on the ideas to illuminate without being too leading. Ideas for formative assessments/checking for understanding: Exit slip describing how to find slope from a table Have students compare and contrast two different tables (can be between two tables on the same activity or tables from different activities) Exit slip highlighting importance of difference column Discuss the importance of examining change in x-value in addition to yvalue Activities: 1. Slope from a Table I (consecutive x values) 2. Slope from a Table II ( equal x value intervals) 3. Slope from a Table III (nonconsecutive x values) 4. Slope from a Table IV (linear/nonlinear) 5. Situations to Tables B. Slope from a Graph Goal: Students should be able to find the slope/rate of change from a graph. Ideas to Illuminate: Reading graphs left to right Counting method (up and over) Connections to the change in x and the change in y like students did from the table—it will make using the formula easier to remember. Identify positive, negative, undefined (no), and zero slopes. Suggested Questions as Monitor: Using your graph, can you explain the rate of change? What can you tell me about the value of the slope just by glancing at the graph? How would you compare finding the slope of the graph verses a table? Ask questions that focus on the ideas to illuminate without being too leading. Ideas for formative assessments/checking for understanding: Exit slip describing how to find the rate of change using a graph? Have students explain the connection between looking at a graph and whether the slope is positive, negative, zero or undefined. Activities: 1. Finding Slope from a Graph I (Given 2 points) 2. Graph and Slope Match (Matching) 3. Finding Slope from a Graph II (No points given) 4. Slopes, Tables, and Graphs I (x and y labels given/connections to tables/graphs/story) 5. Slopes, Tables, and Graphs II (x and y labels not given/connections to tables/graphs/story) C. Slope from a Situation Goal: Students should be able to find slope/rate of change from a situation or story. Ideas to Illuminate: Connections to making tables or graphs of the information from the story Identify slope as what is changing in the situation Suggested Questions as Monitor: Can you use what we have learned to find slope another way? (This is to prompt students that are struggling with slope from situations to use the other representations to become more comfortable.) Ask questions that focus on the ideas to illuminate without being too leading. Ideas for formative assessments/checking for understanding: Have students show connections to the slope in multiple representations Exit slip describing how to find the rate of change in a situation Activities: 1. Slope from Situation I (asked to make table and graph from situation) 2. Slope from Situation II (given situation) 3. Slope from Situation III (compare to situations from before) D. Slope from Two Points Goal: Students should be able to find slope/rate of change from two points Ideas to Illuminate: Formula: change in y and change in x or m y 2 y1 x 2 x1 Consistency between ordered pairs (left to right) Rise over run and not the reciprocal Connections to the previous methods of finding slopes (tables, graphs, and situations) to help when only given two points. Suggested Questions as Monitor: Can you use something that we have learned before to find the slope? Can you find slope in another representation to check your answer? What does slope mean? (for students that find run over rise) Ask questions that focus on the ideas to illuminate without being too leading. Ideas for formative assessments/checking for understanding: Have students discuss how the formula connects to the graph Exit slip describe how to find slope from two points Activities: 1. Find Slope between Points I (two ordered pairs) 2. Find Slope between Points II (two ordered pairs) E. Slope from an Equation Goal: Students should be able to find slope/rate of change from an equation (slopeintercept or standard form.) Ideas to Illuminate: Connect what they have learned about tables and graphs to see where that slope is represented in the equation Find the slope in the form y = mx + b Manipulate an equation in standard form to find the slope Find the x- and y-intercepts and use the slope from two-points formula. Suggested Questions as Monitor: Can you use a method that we have worked with before to find the slope? Ask questions that focus on the ideas to illuminate without being too leading. Ideas for formative assessments/checking for understanding: Exit slip describe how to find the rate of change in an equation Have students show the connections to the equation from the table and graph Activities: 1. Equations to Tables and Graphs (Equations in slope-intercept form and asked for a table and graph 2. Slope from Equations I (Equations in slope-intercept form) 3. Slope from Equations II (Equations in standard form) 4. Multiple Representations I – you may want to take the graphs off depending on the needs of your students (Context) 5. Multiple Representations II (table of values) 6. Multiple Representations III (graph) 7. Multiple Representations IV (equation) 8. Multiple Representations Template (make your own filling in any of the boxes) F. Slope Review Goal: Students should be able to find slope/rate of change given all types of information Ideas to Illuminate: Which method is easier depending on the given information All ideas from the above sections Suggested Questions as Monitor: Can you find the slope using another representation to check? Why did you choose the method you did? Ask questions that focus on the ideas to illuminate without being too leading. Ideas for formative assessments/checking for understanding: Have students describe the similarities between all the ways to find slope Exit slip given (a type of information) determine how you would find the slope and describe why they used that method Activities: 9. Slope Review I 10. Slope Review II 11. Slope Review Multiple Choice


