EEP 1/Econ 3 Peter Berck ... Do all four questions. Points are shown in ().
advertisement
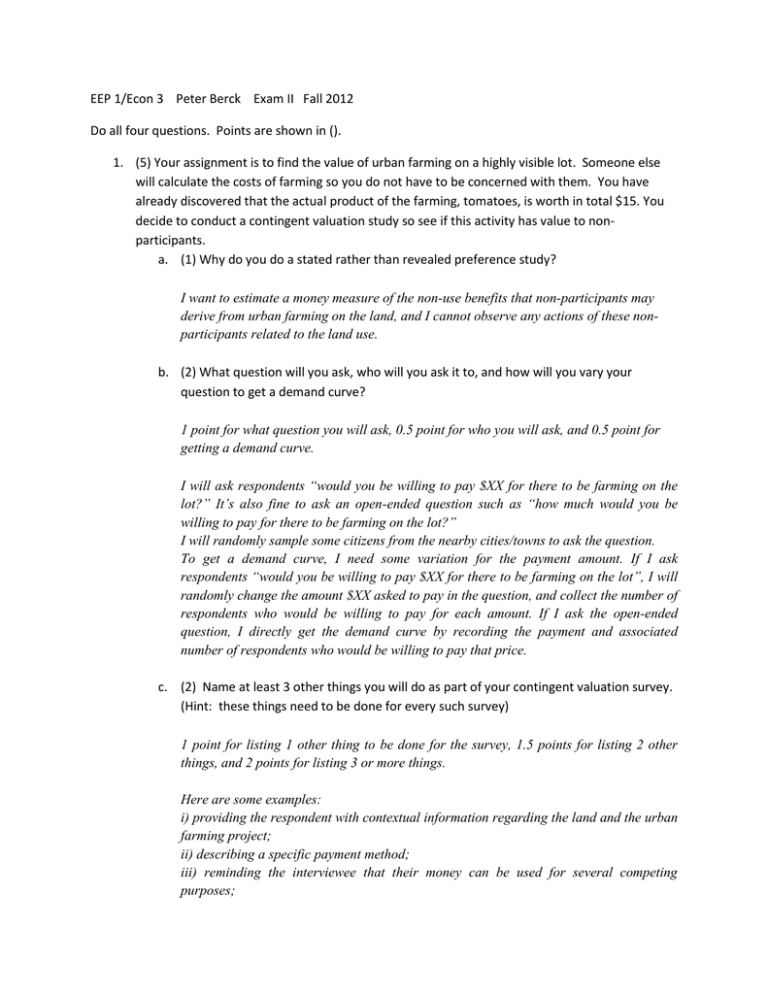
EEP 1/Econ 3 Peter Berck Exam II Fall 2012 Do all four questions. Points are shown in (). 1. (5) Your assignment is to find the value of urban farming on a highly visible lot. Someone else will calculate the costs of farming so you do not have to be concerned with them. You have already discovered that the actual product of the farming, tomatoes, is worth in total $15. You decide to conduct a contingent valuation study so see if this activity has value to nonparticipants. a. (1) Why do you do a stated rather than revealed preference study? I want to estimate a money measure of the non-use benefits that non-participants may derive from urban farming on the land, and I cannot observe any actions of these nonparticipants related to the land use. b. (2) What question will you ask, who will you ask it to, and how will you vary your question to get a demand curve? 1 point for what question you will ask, 0.5 point for who you will ask, and 0.5 point for getting a demand curve. I will ask respondents “would you be willing to pay $XX for there to be farming on the lot?” It’s also fine to ask an open-ended question such as “how much would you be willing to pay for there to be farming on the lot?” I will randomly sample some citizens from the nearby cities/towns to ask the question. To get a demand curve, I need some variation for the payment amount. If I ask respondents “would you be willing to pay $XX for there to be farming on the lot”, I will randomly change the amount $XX asked to pay in the question, and collect the number of respondents who would be willing to pay for each amount. If I ask the open-ended question, I directly get the demand curve by recording the payment and associated number of respondents who would be willing to pay that price. c. (2) Name at least 3 other things you will do as part of your contingent valuation survey. (Hint: these things need to be done for every such survey) 1 point for listing 1 other thing to be done for the survey, 1.5 points for listing 2 other things, and 2 points for listing 3 or more things. Here are some examples: i) providing the respondent with contextual information regarding the land and the urban farming project; ii) describing a specific payment method; iii) reminding the interviewee that their money can be used for several competing purposes; iv) conducting a debriefing to ensure the respondent understood the questions or check whether protest responses were made. The debrief typically also includes questions about the respondent’s characteristics, such as income, education level, and attitude towards environmental issues. 2. (8) This question refers to the diagram below, which describes a firm’s choice of inputs. Write your name on the diagram and turn it in with your exam. The price of “Other Stuff” is 4. a. (2) What is the price for “Clean Air” for the solid line? For the dashed line? What economic term of are (word) is used to describe these lines? 0.5 point for calculating the price for air for the solid line. 0.5 point for calculating the price for air for the dashed line. 1 point for the economic term for these lines. For the solid line: The vertical intercept for “other stuff” is 80, and the horizontal intercept for air is 40 ⟹ 𝑄𝑠𝑡𝑢𝑓𝑓 = 80 when 𝑄𝑎𝑖𝑟 = 0, and 𝑄𝑎𝑖𝑟 = 40 when 𝑄𝑠𝑡𝑢𝑓𝑓 = 0 ⟹ Total Expenditure for the solid line is 𝐸𝑠𝑜𝑙𝑖𝑑 = 𝑝𝑠𝑡𝑢𝑓𝑓 × 𝑄𝑠𝑡𝑢𝑓𝑓 = 4 × 80 = 320 = 𝑝𝑎𝑖𝑟 × 𝑄𝑎𝑖𝑟 = 𝑝𝑎𝑖𝑟 × 40 ⟹ 𝑝𝑎𝑖𝑟 = 8 for the solid line. Similarly, we calculate the price for air for the dashed line: 𝐸𝑑𝑎𝑠ℎ𝑒𝑑 = 𝑝𝑠𝑡𝑢𝑓𝑓 × 𝑄𝑠𝑡𝑢𝑓𝑓 = 4 × 200 = 800 = 𝑝𝑎𝑖𝑟 × 𝑄𝑎𝑖𝑟 = 𝑝𝑎𝑖𝑟 × 25 ⟹ 𝑝𝑎𝑖𝑟 = 32 for the dashed line. These lines are isocost lines. b. (1) Draw an isoquant tangent to both of these lines. Identify the points of tangency on your graph (you may just put a dot of the graph to show the point. ) Label the one on the high clean air price line, “with high price.” The red isoquant curve drawn in the graph is just an example. You can get full credit as long as your isoquant curve is tangent to both of the isocost lines and you identify the two tangencies. c. (1)Make a chart with two columns and show the amount of Clean Air demanded by the firm as a function of the price of clean air. Read the graph. Also, this is just an example. You can get full credit by reading your own numbers in your graph, as long as they are consistent with your isoconst and isoquant curves. In my example, when 𝑝𝑎𝑖𝑟 = 8, the x-coordinate for the tangency of the solid isocost line and the isoquant curve is 23. When 𝑝𝑎𝑖𝑟 = 32, the x-coordinate for the tangency of the dashed isocost line and the isoquant curve is 18. Therefore, I get the following chart: Price of clean air 8 32 Clean air demanded 23 18 d. (2)Now draw one further line on your diagram and use it to show the cost for the “with high price” input bundle if the price of clean air were the low price instead. Compare the cost of choosing this bundle at the low and high price for air. 1 point for drawing the extra isocost line. 1 point for comparing the cost. I draw the dashed blue line which is parallel to the solid blue line and goes through the tangency “with high price”. The prices represented by the dashed blue line are 𝑝𝑠𝑡𝑢𝑓𝑓 = 4 and 𝑝𝑎𝑖𝑟 = 8. Calculate the cost of choosing the “with high price” input bundle: At the low price for air: I use the vertical intercept of the dashed blue line to calculate the cost, which is 90*4=360. At the high price for air: I use the vertical intercept of the dashed green line to calculate the cost, which is 200*4=800. e. (2) Explain why your findings are important for pollution control. You will want to mention effluent standard and effluent tax. The finding shows that an effluent standard costs less than an effluent tax that causes the same reduction in pollution with output held constant. 3. (4) Answer all four parts a. (1)Define the cost function, C(q). The minimum cost to produce output q. b. (1) Explain why the shutdown point is at the minimum point of AVC. We compare a firm’s profit of producing output Q and 0. If a firm produces output Q, 𝜋(𝑄) = 𝑝 × 𝑄 – 𝑉𝐶 (𝑄)– 𝐹𝐶 = 𝑄 × (𝑝 − 𝐴𝑉𝐶)– 𝐹𝐶. If the firm shuts down, 𝜋(0) = 𝑝 × 0 – 𝑉𝐶 (0)– 𝐹𝐶 = −𝐹𝐶. If 𝑝 > 𝑚𝑖𝑛𝑖𝑚𝑢𝑚 𝐴𝑉𝐶, the firm’s profit of producing output Q will be less negative compared to produce nothing, so the firm will produce (not shutdown). If 𝑝 < 𝑚𝑖𝑛𝑖𝑚𝑢𝑚 𝐴𝑉𝐶, the firm’s profit of producing output Q will be more negative compared to produce nothing, so the firm will shut down (key point). If If 𝑝 = 𝑚𝑖𝑛𝑖𝑚𝑢𝑚 𝐴𝑉𝐶, 𝜋(𝑄) = −𝐹𝐶 = 𝜋(0), the firm is indifferent between operation and shutdown. Therefore, the shutdown point is at the minimum point of AVC. c. (1) Explain why the average cost curve is likely U-shaped. At low levels of output, average total cost (AC) falls because the falling average fixed cost dominates the rising average variable cost, while at higher levels of output, the firm runs into the constraint of a fixed plant size, resulting in high marginal costs, which are above AC and pull AC up. d. (1) Define marginal cost. Marginal cost is the additional cost of making one more unit of output. MC(Q)=C(Q+1)-C(Q) 4. Readings: Do A or B a. (3) What is grandfathering and new source review? How would you undermine the intent of the Clean Air Act with respect to new source review if your political party was beholden to the coal and petroleum industries? 1 point for explaining grandfathering, 1 point for explaining new source review, and 1 point for undermining the Clean Air Act with respect to new source review. Grandfathering means that new plants face stricter environmental regulation than existing plants. For Clean Air Act, it allowed older more polluting power plants and refineries to run under old rules. Only when they were altered did they have to comply with more stringent rules, resulting in losing grandfather status. It is intended to ease the burden for facilities designed before the new requirements. The new source review was part of the 1977 Clean Air Act Amendments. The purpose of which was to make older firms transition to cleaner technology and new firms to adopt cleaner technology. It required firms to undergo a review if planning to build new facilities or undergo reconstruction. It allowed older firms to make minor changes/repairs only if they constituted minor “routine maintenance”; if there was a major modification they had to adopt new cleaner technology. What constituted reconstruction versus routine maintenance was often ambiguous. Investigations by the EPA found that firms had made major modifications without complying, which led to many lawsuits. One way to undermine the new source review is to institute new rules as the Bush administration did, making 20% of the value of the generating unit be the threshold for what constituted a major modification versus a routine maintenance instead of the 0.75% suggested by the EPA. With this increased threshold, in practice most plants were able to do whatever upgrades they wanted without having to conform to the EPA standards. Another way to frustrate is just inaction. Don’t prosecute. In addition to making new rules, the Bush administration simply did not spend the money Congress appropriated for enforcement. b. (3) What are three important concepts from Krutilla’s “Conservation Reconsidered”? Briefly define each. 1 point for each concept. Any three concepts that you can trace to the article are fine. You should give definitions of these concepts, not just restate Krutilla’s arguments that government should take actions to preserve environment. Here are some examples: Option demand or option value: a willingness to pay for retaining an option to use an area or facility in the future. Such a demand may exist even though there is no current intention to use the area or facility in question and the option may never be exercised. Existence service or existence value: a good from which people benefit even if they have no direct experience or contact with it. The mere fact that the good exists makes them better off. Irreversible consequence: environmental damages that cannot be reversed. Perfect price discrimination: charge each consumer a different price based on his/her willingness to pay such that consumer surplus is zero. Increasing demand: as people gain more experience with outdoor recreational activities, we will demand outdoor recreational facilities (and unspoiled land for these activities) more and more. Asymmetric technology: it is likely that technology will continue to improve in the efficiency with which we produce goods, but technology is unlikely to be able to find ways to recreate unique natural phenomena, so the supply of natural phenomena is virtually inelastic. Other Stuff 200 160 120 80 with high price 40 0 0 4 8 12 16 20 Air 24 28 32 36 40
