2007Midterm
advertisement
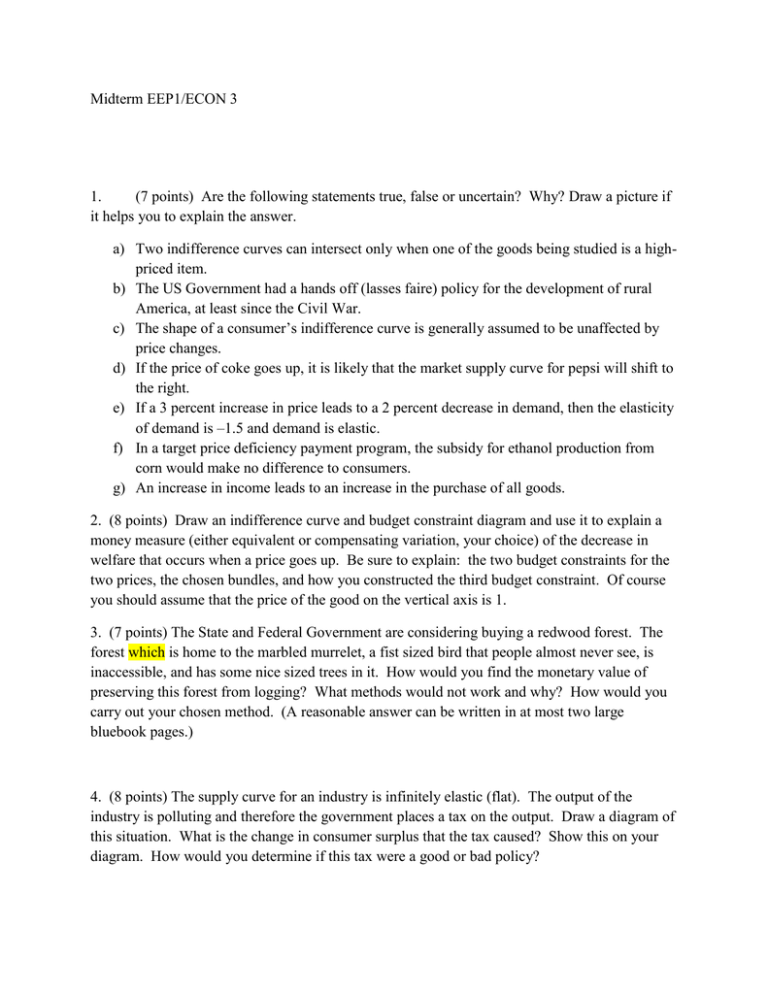
Midterm EEP1/ECON 3 1. (7 points) Are the following statements true, false or uncertain? Why? Draw a picture if it helps you to explain the answer. a) Two indifference curves can intersect only when one of the goods being studied is a highpriced item. b) The US Government had a hands off (lasses faire) policy for the development of rural America, at least since the Civil War. c) The shape of a consumer’s indifference curve is generally assumed to be unaffected by price changes. d) If the price of coke goes up, it is likely that the market supply curve for pepsi will shift to the right. e) If a 3 percent increase in price leads to a 2 percent decrease in demand, then the elasticity of demand is –1.5 and demand is elastic. f) In a target price deficiency payment program, the subsidy for ethanol production from corn would make no difference to consumers. g) An increase in income leads to an increase in the purchase of all goods. 2. (8 points) Draw an indifference curve and budget constraint diagram and use it to explain a money measure (either equivalent or compensating variation, your choice) of the decrease in welfare that occurs when a price goes up. Be sure to explain: the two budget constraints for the two prices, the chosen bundles, and how you constructed the third budget constraint. Of course you should assume that the price of the good on the vertical axis is 1. 3. (7 points) The State and Federal Government are considering buying a redwood forest. The forest which is home to the marbled murrelet, a fist sized bird that people almost never see, is inaccessible, and has some nice sized trees in it. How would you find the monetary value of preserving this forest from logging? What methods would not work and why? How would you carry out your chosen method. (A reasonable answer can be written in at most two large bluebook pages.) 4. (8 points) The supply curve for an industry is infinitely elastic (flat). The output of the industry is polluting and therefore the government places a tax on the output. Draw a diagram of this situation. What is the change in consumer surplus that the tax caused? Show this on your diagram. How would you determine if this tax were a good or bad policy?
