701 att a
advertisement

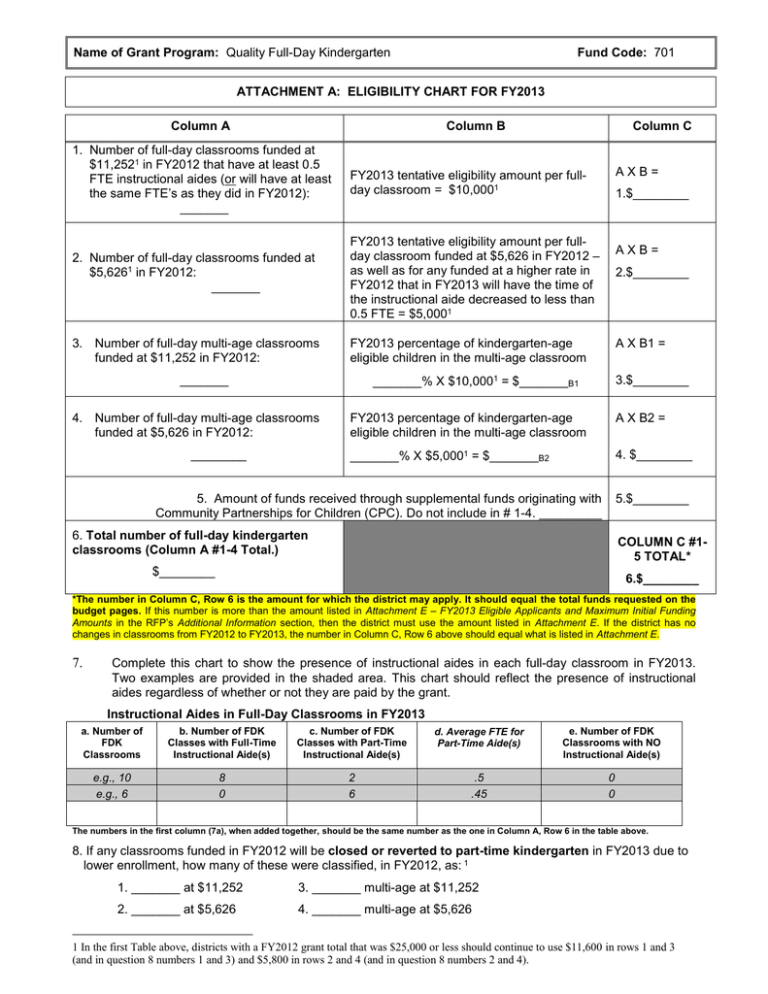
Name of Grant Program: Quality Full-Day Kindergarten Fund Code: 701 ATTACHMENT A: ELIGIBILITY CHART FOR FY2013 Column A Column B Column C 1. Number of full-day classrooms funded at $11,2521 in FY2012 that have at least 0.5 FTE instructional aides (or will have at least the same FTE’s as they did in FY2012): _______ FY2013 tentative eligibility amount per fullday classroom = $10,0001 2. Number of full-day classrooms funded at $5,6261 in FY2012: _______ FY2013 tentative eligibility amount per fullday classroom funded at $5,626 in FY2012 – as well as for any funded at a higher rate in FY2012 that in FY2013 will have the time of the instructional aide decreased to less than 0.5 FTE = $5,0001 3. Number of full-day multi-age classrooms funded at $11,252 in FY2012: FY2013 percentage of kindergarten-age eligible children in the multi-age classroom _______ AXB= 1.$________ AXB= 2.$________ A X B1 = 3.$________ _______% X $10,0001 = $_______B1 4. Number of full-day multi-age classrooms funded at $5,626 in FY2012: ________ FY2013 percentage of kindergarten-age eligible children in the multi-age classroom A X B2 = _______% X $5,0001 = $_______B2 4. $________ 5. Amount of funds received through supplemental funds originating with Community Partnerships for Children (CPC). Do not include in # 1-4. _________ 5.$________ 6. Total number of full-day kindergarten classrooms (Column A #1-4 Total.) COLUMN C #15 TOTAL* $________ 6.$________ *The number in Column C, Row 6 is the amount for which the district may apply. It should equal the total funds requested on the budget pages. If this number is more than the amount listed in Attachment E – FY2013 Eligible Applicants and Maximum Initial Funding Amounts in the RFP’s Additional Information section, then the district must use the amount listed in Attachment E. If the district has no changes in classrooms from FY2012 to FY2013, the number in Column C, Row 6 above should equal what is listed in Attachment E. 7. Complete this chart to show the presence of instructional aides in each full-day classroom in FY2013. Two examples are provided in the shaded area. This chart should reflect the presence of instructional aides regardless of whether or not they are paid by the grant. Instructional Aides in Full-Day Classrooms in FY2013 a. Number of FDK Classrooms b. Number of FDK Classes with Full-Time Instructional Aide(s) c. Number of FDK Classes with Part-Time Instructional Aide(s) d. Average FTE for Part-Time Aide(s) e. Number of FDK Classrooms with NO Instructional Aide(s) e.g., 10 e.g., 6 8 0 2 6 .5 .45 0 0 The numbers in the first column (7a), when added together, should be the same number as the one in Column A, Row 6 in the table above. 8. If any classrooms funded in FY2012 will be closed or reverted to part-time kindergarten in FY2013 due to lower enrollment, how many of these were classified, in FY2012, as: 1 1. _______ at $11,252 3. _______ multi-age at $11,252 2. _______ at $5,626 4. _______ multi-age at $5,626 1 In the first Table above, districts with a FY2012 grant total that was $25,000 or less should continue to use $11,600 in rows 1 and 3 (and in question 8 numbers 1 and 3) and $5,800 in rows 2 and 4 (and in question 8 numbers 2 and 4).


