Summary List of Mathematics Standards Met by SC MAPS Activities
advertisement
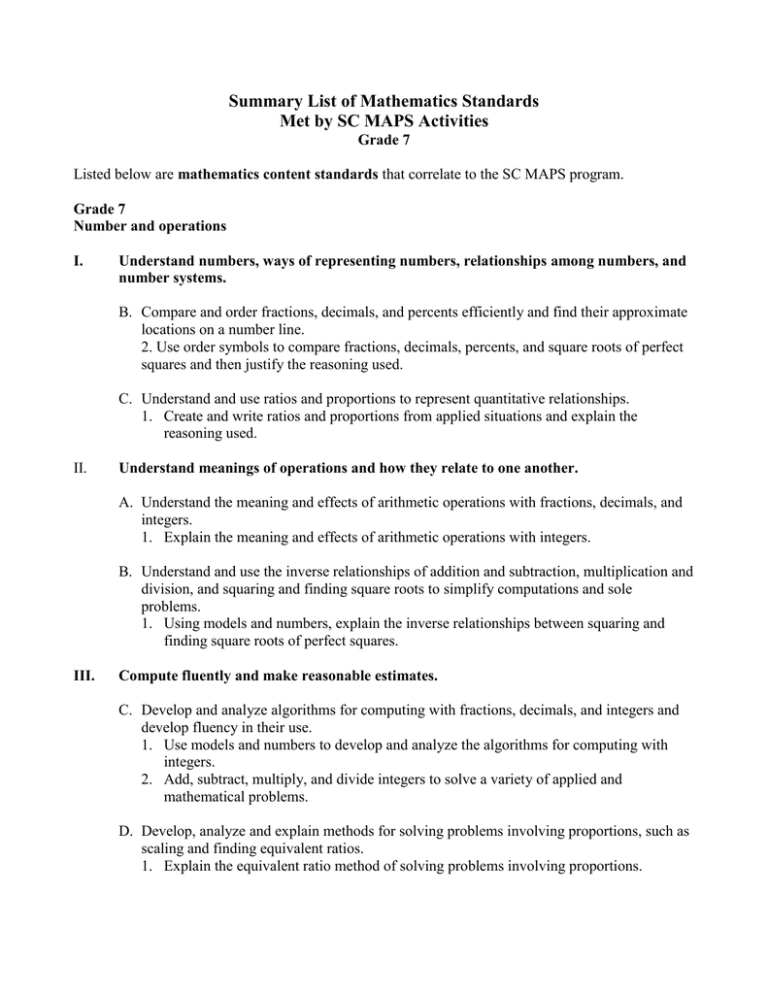
Summary List of Mathematics Standards Met by SC MAPS Activities Grade 7 Listed below are mathematics content standards that correlate to the SC MAPS program. Grade 7 Number and operations I. Understand numbers, ways of representing numbers, relationships among numbers, and number systems. B. Compare and order fractions, decimals, and percents efficiently and find their approximate locations on a number line. 2. Use order symbols to compare fractions, decimals, percents, and square roots of perfect squares and then justify the reasoning used. C. Understand and use ratios and proportions to represent quantitative relationships. 1. Create and write ratios and proportions from applied situations and explain the reasoning used. II. Understand meanings of operations and how they relate to one another. A. Understand the meaning and effects of arithmetic operations with fractions, decimals, and integers. 1. Explain the meaning and effects of arithmetic operations with integers. B. Understand and use the inverse relationships of addition and subtraction, multiplication and division, and squaring and finding square roots to simplify computations and sole problems. 1. Using models and numbers, explain the inverse relationships between squaring and finding square roots of perfect squares. III. Compute fluently and make reasonable estimates. C. Develop and analyze algorithms for computing with fractions, decimals, and integers and develop fluency in their use. 1. Use models and numbers to develop and analyze the algorithms for computing with integers. 2. Add, subtract, multiply, and divide integers to solve a variety of applied and mathematical problems. D. Develop, analyze and explain methods for solving problems involving proportions, such as scaling and finding equivalent ratios. 1. Explain the equivalent ratio method of solving problems involving proportions. Algebra I. Understand patterns, relations, and functions. B. Relate and compare different forms of representations for a relationship. 1. Use different forms of representing information (e.g., graphical, symbolic, tabular). II. Represent and analyze mathematical situations and structures using algebraic symbols. B. Explore relationships between symbolic expressions and graphs of lines, paying particular attention to the meaning of intercept and slope. 1. Analyze quantitative changes by comparing and contrasting numerical patterns in tables with their respective graphs in the coordinate plane. Geometry I. Analyze characteristics and properties of two – and three- dimensional geometric shapes and develop mathematical arguments about geometric relationships. C. Create and critique inductive and deductive arguments concerning geometric ideas and relationships, such as congruence, similarity, and the Pythagorean relationship. 1. Compare and contrast attributes of similar figures and the attributes of congruent figures. II. Specify locations and describe spatial relationships using coordinate geometry and other representational systems. A. Use coordinate geometry to represent and examine the properties of geometric shapes. 1. Identify and graph ordered pairs in the four quadrants of a coordinate plane. Measurement i. Understand measurable attributes of objects and the units, systems, and processes of measurement. A. Understand both metric and customary systems of measurement. 1. Explain the relationship between the metric system and the base-ten number system. B. Understand relationships among units and convert from one unit to another within the same system. 1. Compare and convert units of measure for length, weight/mass, and volume within the U.S. customary system and the metric system. C. Understand, select, and use units of appropriate size and type to measure angles, perimeter, area, surface area, and volume. 1. Use appropriate units of measure to label surface area and volume. II. Apply appropriate techniques, tools, and formulas to determine measurements. A. Use common benchmarks to select appropriate methods for estimating measurements. 1. Use appropriate methods to approximate the surface area and volume of irregular figures. C. Develop and use formulas to determine the circumference of circles and the area of triangles, parallelograms, trapezoids, and circles and develop strategies to find the area of more-complex shapes. 1. Use measurements and formulas to solve real-world and mathematical problems. 2. Create and solve problems by finding the circumference and/or area of a circle when given the diameter or radius. D. Develop strategies to determine the surface area and volume of selected prisms, pyramids, and cylinders. 1. Investigate and describe the relationship between the area of the base and the volume of a prism, pyramid, and cylinder. E. Solve simple problems involving rates and derived measurements for such attributes as velocity and density. 1. Apply rates to solve problems in real-world situations. III. Develop and evaluate inferences and predictions that are based on data. A. Use observations about differences between two or more samples to make conjectures about the populations from which the samples were taken. 1. Make inferences and predictions based on the analysis of sample data. Data Analysis and Probability I. Formulate questions that can be addressed with data and collect, organize, and display relevant data to answer them. B. Select, create, and use appropriate graphical representations of data, including histograms, box plots, and scatterplots. 1. Organize, display, and interpret data in a variety of ways including box-and-whisker plots. II. Select and use appropriate statistical methods to analyze data. B. Discuss and understand the correspondence between data sets and their graphical representations, especially histograms, stem-and-leaf plots, box plots, and scatterplots. 1. Describe the relationship between a data set and its corresponding box plot or circle graph.
