Summary List of Mathematics Standards Met by SC MAPS Activities
advertisement
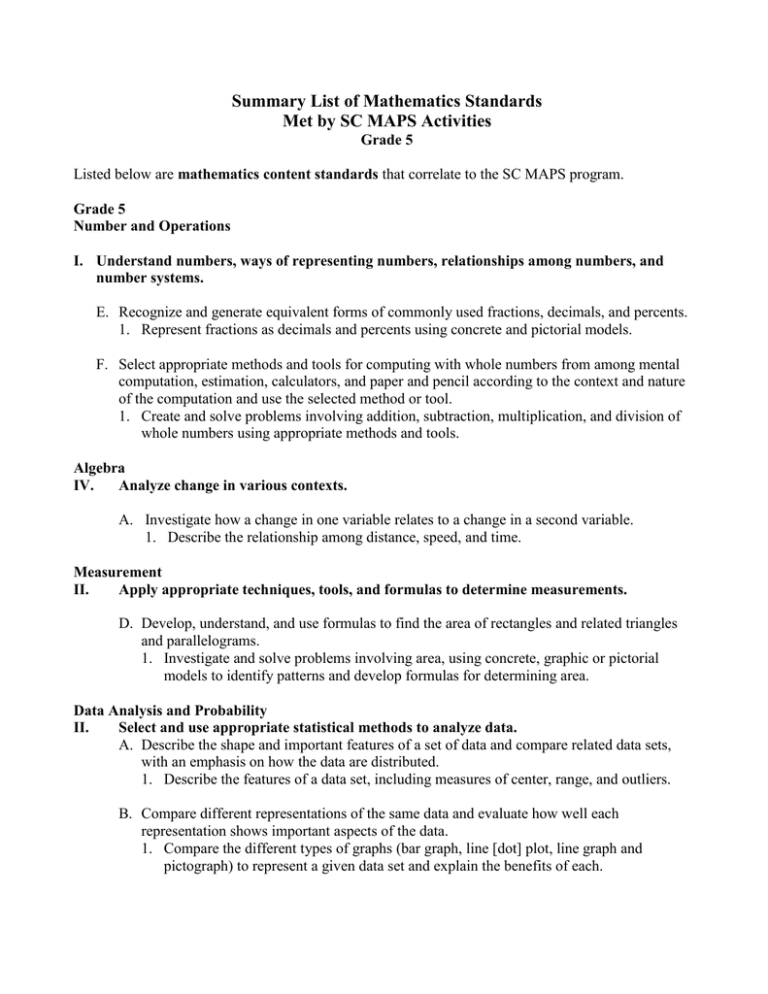
Summary List of Mathematics Standards Met by SC MAPS Activities Grade 5 Listed below are mathematics content standards that correlate to the SC MAPS program. Grade 5 Number and Operations I. Understand numbers, ways of representing numbers, relationships among numbers, and number systems. E. Recognize and generate equivalent forms of commonly used fractions, decimals, and percents. 1. Represent fractions as decimals and percents using concrete and pictorial models. F. Select appropriate methods and tools for computing with whole numbers from among mental computation, estimation, calculators, and paper and pencil according to the context and nature of the computation and use the selected method or tool. 1. Create and solve problems involving addition, subtraction, multiplication, and division of whole numbers using appropriate methods and tools. Algebra IV. Analyze change in various contexts. A. Investigate how a change in one variable relates to a change in a second variable. 1. Describe the relationship among distance, speed, and time. Measurement II. Apply appropriate techniques, tools, and formulas to determine measurements. D. Develop, understand, and use formulas to find the area of rectangles and related triangles and parallelograms. 1. Investigate and solve problems involving area, using concrete, graphic or pictorial models to identify patterns and develop formulas for determining area. Data Analysis and Probability II. Select and use appropriate statistical methods to analyze data. A. Describe the shape and important features of a set of data and compare related data sets, with an emphasis on how the data are distributed. 1. Describe the features of a data set, including measures of center, range, and outliers. B. Compare different representations of the same data and evaluate how well each representation shows important aspects of the data. 1. Compare the different types of graphs (bar graph, line [dot] plot, line graph and pictograph) to represent a given data set and explain the benefits of each.
