Optional second example of ROC Curve: Sensitivity versus 1-Specificity
advertisement
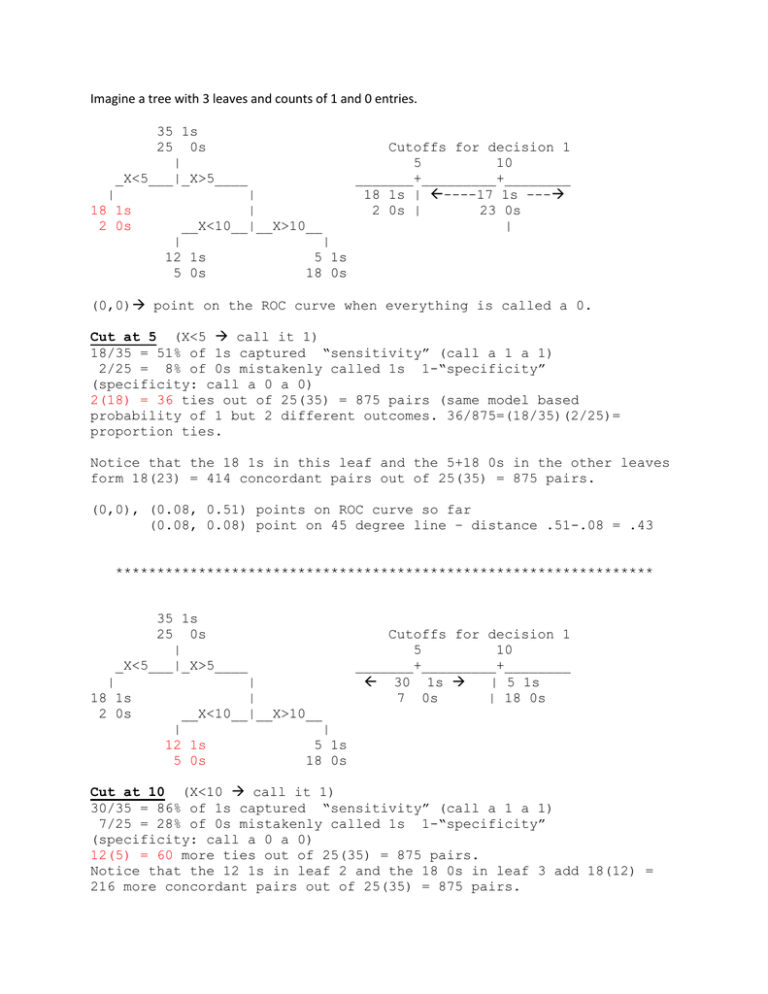
Imagine a tree with 3 leaves and counts of 1 and 0 entries.
35 1s
25 0s
Cutoffs for decision 1
|
5
10
_X<5___|_X>5____
_______+_________+________
|
|
18 1s | ----17 1s ---
18 1s
|
2 0s |
23 0s
2 0s
__X<10__|__X>10__
|
|
|
12 1s
5 1s
5 0s
18 0s
(0,0) point on the ROC curve when everything is called a 0.
Cut at 5 (X<5 call it 1)
18/35 = 51% of 1s captured “sensitivity” (call a 1 a 1)
2/25 = 8% of 0s mistakenly called 1s 1-“specificity”
(specificity: call a 0 a 0)
2(18) = 36 ties out of 25(35) = 875 pairs (same model based
probability of 1 but 2 different outcomes. 36/875=(18/35)(2/25)=
proportion ties.
Notice that the 18 1s in this leaf and the 5+18 0s in the other leaves
form 18(23) = 414 concordant pairs out of 25(35) = 875 pairs.
(0,0), (0.08, 0.51) points on ROC curve so far
(0.08, 0.08) point on 45 degree line – distance .51-.08 = .43
*****************************************************************
35 1s
25 0s
Cutoffs for decision 1
|
5
10
_X<5___|_X>5____
_______+_________+________
|
|
30 1s
| 5 1s
18 1s
|
7 0s
| 18 0s
2 0s
__X<10__|__X>10__
|
|
12 1s
5 1s
5 0s
18 0s
Cut at 10 (X<10 call it 1)
30/35 = 86% of 1s captured “sensitivity” (call a 1 a 1)
7/25 = 28% of 0s mistakenly called 1s 1-“specificity”
(specificity: call a 0 a 0)
12(5) = 60 more ties out of 25(35) = 875 pairs.
Notice that the 12 1s in leaf 2 and the 18 0s in leaf 3 add 18(12) =
216 more concordant pairs out of 25(35) = 875 pairs.
(0.28, 0.86) new point on ROC curve
(0.28, 0.28) point on 45 degree line – distance .86-.28 = .58
(1,1) is ROC point when everything is called a 1.
Pr{1} decreasing
Area under curve = proportion concordant + (1/2)( proportion tied )=”AUC”=”C statistic”
2(area under curve)-1 = “Gini coefficient”
Gini here is related to the “Lorenz curve” which is essentially an ROC type curve reflected in the 45
degree line.

