mt1fall2004-1.doc
advertisement

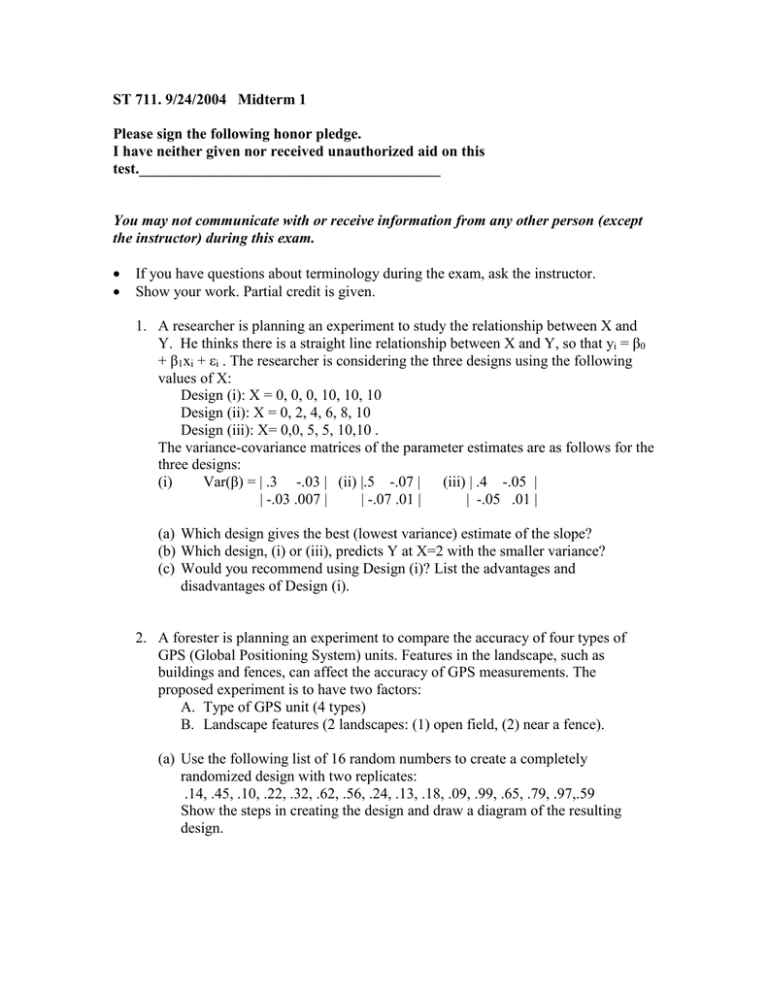
ST 711. 9/24/2004 Midterm 1 Please sign the following honor pledge. I have neither given nor received unauthorized aid on this test.________________________________________ You may not communicate with or receive information from any other person (except the instructor) during this exam. If you have questions about terminology during the exam, ask the instructor. Show your work. Partial credit is given. 1. A researcher is planning an experiment to study the relationship between X and Y. He thinks there is a straight line relationship between X and Y, so that yi = β0 + β1xi + εi . The researcher is considering the three designs using the following values of X: Design (i): X = 0, 0, 0, 10, 10, 10 Design (ii): X = 0, 2, 4, 6, 8, 10 Design (iii): X= 0,0, 5, 5, 10,10 . The variance-covariance matrices of the parameter estimates are as follows for the three designs: (i) Var(β) = | .3 -.03 | (ii) |.5 -.07 | (iii) | .4 -.05 | | -.03 .007 | | -.07 .01 | | -.05 .01 | (a) Which design gives the best (lowest variance) estimate of the slope? (b) Which design, (i) or (iii), predicts Y at X=2 with the smaller variance? (c) Would you recommend using Design (i)? List the advantages and disadvantages of Design (i). 2. A forester is planning an experiment to compare the accuracy of four types of GPS (Global Positioning System) units. Features in the landscape, such as buildings and fences, can affect the accuracy of GPS measurements. The proposed experiment is to have two factors: A. Type of GPS unit (4 types) B. Landscape features (2 landscapes: (1) open field, (2) near a fence). (a) Use the following list of 16 random numbers to create a completely randomized design with two replicates: .14, .45, .10, .22, .32, .62, .56, .24, .13, .18, .09, .99, .65, .79, .97,.59 Show the steps in creating the design and draw a diagram of the resulting design. An experiment like this was conducted. Some SAS output from this experiment is shown below. Source Sum of Squares DF Model Error Corrected Total 7 8 15 Source 391.9375000 28.5000000 420.4375000 DF A B A*B Mean Square 3 1 3 Type III SS 55.9910714 3.5625000 Mean Square 297.1875000 60.0625000 34.6875000 A B y LSMEAN 1 1 2 2 3 3 4 4 1 2 1 2 1 2 1 2 11.0000000 12.5000000 5.5000000 6.0000000 14.0000000 21.5000000 10.5000000 16.5000000 99.0625000 60.0625000 11.5625000 Parameter Intercept a a a a b b a*b a*b a*b a*b Estimates Estimate 16.50000000 B 1 -4.00000000 B 2 -10.50000000 B 3 5.00000000 B 4 0.00000000 B 1 -6.00000000 B 2 0.00000000 B 1 1 4.50000000 B 1 2 0.00000000 B 2 1 5.50000000 B 2 2 0.00000000 B Standard Error 1.33463478 1.88745861 1.88745861 1.88745861 . 1.88745861 . 2.66926956 . 2.66926956 . a*b a*b a*b a*b 3 3 4 4 2.66926956 . . . . 1 2 1 2 -1.50000000 0.00000000 0.00000000 0.00000000 B B B B NOTE: The X'X matrix has been found to be singular, and a generalized inverse was used to solve the normal equations. Terms whose estimates are followed by the letter 'B' are not uniquely estimable. (b) What is the standard error of the difference between the mean of GPS unit 2 and the mean of the other 3 GPS units? (c) Landscape 2 is near a fence. It is known that fences can interfere with GPS readings. What is the estimated mean difference between GPS units 2 and 4 if the readings are taken in landscape 2? (d) Show how to obtain this estimate from the section of the output labeled “Parameter Estimates”. (e) What is the standard error of the estimated mean difference computed in part (c)? 3. A group making up ballots for an election has four candidates for office. They want to make up 4 different ballots, with the candidate names in a different order on each ballot. Propose a set of 4 ballots such that every candidate appears first on one ballot, second on another ballot, third on another ballot and fourth on another ballot.

