Document 15104616
advertisement
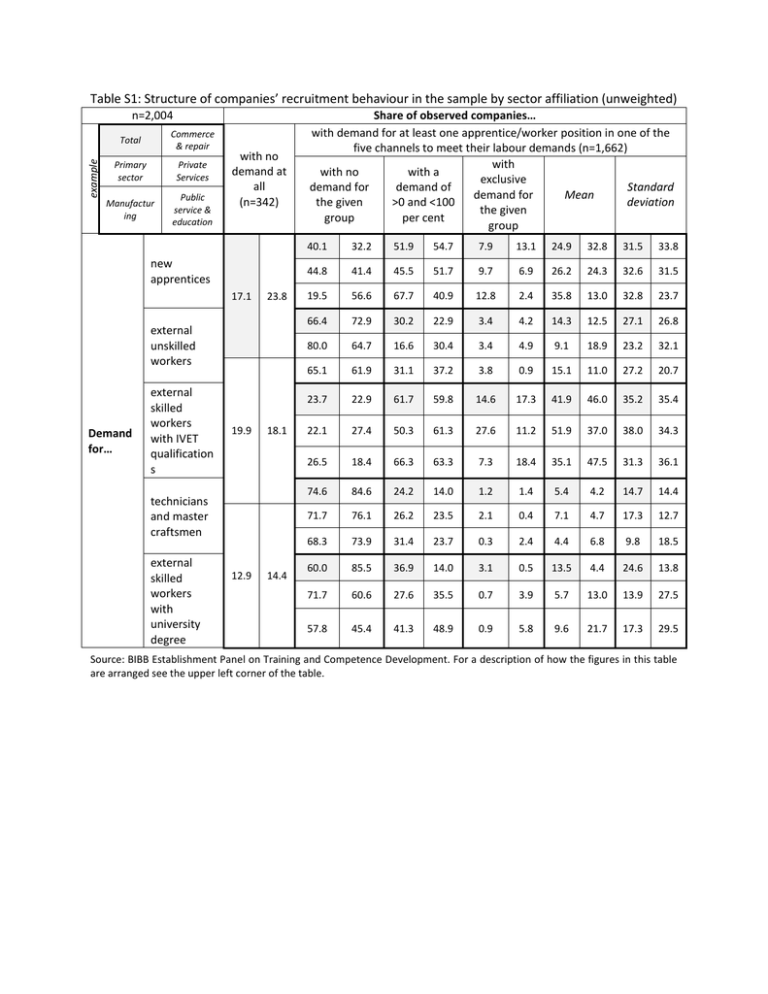
Table S1: Structure of companies’ recruitment behaviour in the sample by sector affiliation (unweighted) example n=2,004 Total Commerce & repair Primary sector Private Services Manufactur ing Public service & education with no demand at all (n=342) new apprentices 17.1 23.8 external unskilled workers Demand for… external skilled workers with IVET qualification s 19.9 18.1 technicians and master craftsmen external skilled workers with university degree 12.9 14.4 Share of observed companies… with demand for at least one apprentice/worker position in one of the five channels to meet their labour demands (n=1,662) with with no with a exclusive demand for demand of Standard demand for Mean the given >0 and <100 deviation the given group per cent group 40.1 32.2 51.9 54.7 7.9 13.1 24.9 32.8 31.5 33.8 44.8 41.4 45.5 51.7 9.7 6.9 26.2 24.3 32.6 31.5 19.5 56.6 67.7 40.9 12.8 2.4 35.8 13.0 32.8 23.7 66.4 72.9 30.2 22.9 3.4 4.2 14.3 12.5 27.1 26.8 80.0 64.7 16.6 30.4 3.4 4.9 9.1 18.9 23.2 32.1 65.1 61.9 31.1 37.2 3.8 0.9 15.1 11.0 27.2 20.7 23.7 22.9 61.7 59.8 14.6 17.3 41.9 46.0 35.2 35.4 22.1 27.4 50.3 61.3 27.6 11.2 51.9 37.0 38.0 34.3 26.5 18.4 66.3 63.3 7.3 18.4 35.1 47.5 31.3 36.1 74.6 84.6 24.2 14.0 1.2 1.4 5.4 4.2 14.7 14.4 71.7 76.1 26.2 23.5 2.1 0.4 7.1 4.7 17.3 12.7 68.3 73.9 31.4 23.7 0.3 2.4 4.4 6.8 9.8 18.5 60.0 85.5 36.9 14.0 3.1 0.5 13.5 4.4 24.6 13.8 71.7 60.6 27.6 35.5 0.7 3.9 5.7 13.0 13.9 27.5 57.8 45.4 41.3 48.9 0.9 5.8 9.6 21.7 17.3 29.5 Source: BIBB Establishment Panel on Training and Competence Development. For a description of how the figures in this table are arranged see the upper left corner of the table.

