Standing Waves
advertisement
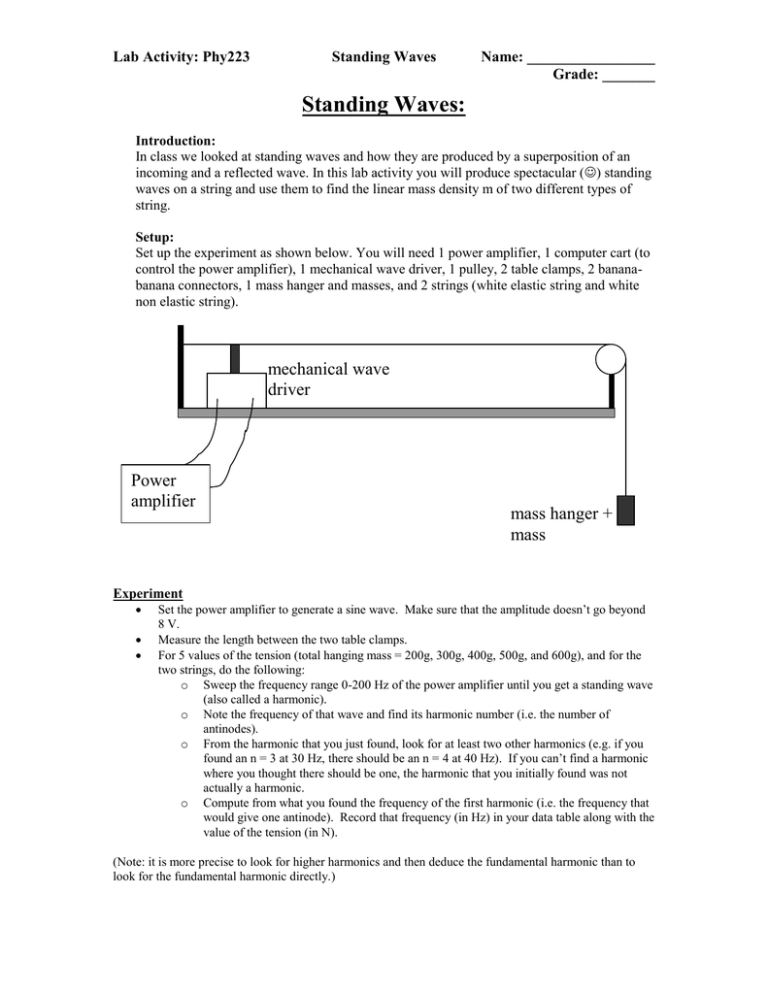
Lab Activity: Phy223 Standing Waves Name: _________________ Grade: _______ Standing Waves: Introduction: In class we looked at standing waves and how they are produced by a superposition of an incoming and a reflected wave. In this lab activity you will produce spectacular () standing waves on a string and use them to find the linear mass density m of two different types of string. Setup: Set up the experiment as shown below. You will need 1 power amplifier, 1 computer cart (to control the power amplifier), 1 mechanical wave driver, 1 pulley, 2 table clamps, 2 bananabanana connectors, 1 mass hanger and masses, and 2 strings (white elastic string and white non elastic string). mechanical wave driver Power amplifier mass hanger + mass Experiment Set the power amplifier to generate a sine wave. Make sure that the amplitude doesn’t go beyond 8 V. Measure the length between the two table clamps. For 5 values of the tension (total hanging mass = 200g, 300g, 400g, 500g, and 600g), and for the two strings, do the following: o Sweep the frequency range 0-200 Hz of the power amplifier until you get a standing wave (also called a harmonic). o Note the frequency of that wave and find its harmonic number (i.e. the number of antinodes). o From the harmonic that you just found, look for at least two other harmonics (e.g. if you found an n = 3 at 30 Hz, there should be an n = 4 at 40 Hz). If you can’t find a harmonic where you thought there should be one, the harmonic that you initially found was not actually a harmonic. o Compute from what you found the frequency of the first harmonic (i.e. the frequency that would give one antinode). Record that frequency (in Hz) in your data table along with the value of the tension (in N). (Note: it is more precise to look for higher harmonics and then deduce the fundamental harmonic than to look for the fundamental harmonic directly.) Lab Activity: Phy223 Standing Waves Name: _________________ Grade: _______ Theory. Show that the tension T of the string is related to the fundamental frequency f 1 by T 4L2 f12 where L is the length of the string, and is the linear mass of the string. Data analysis: For the two strings, plot T versus f12 and find the linear mass from the graph. Also find the linear mass density by measuring the strings’ lengths and mass. Compare the results. Write up: Abstract Data: 1. Organize your data in a table. 2. Plot the two graphs. Theory: Show your derivation of T(f12) Results: Give the two values of that you found. Explain discrepancies.
