Data Graph Analysis Project Instructions
advertisement

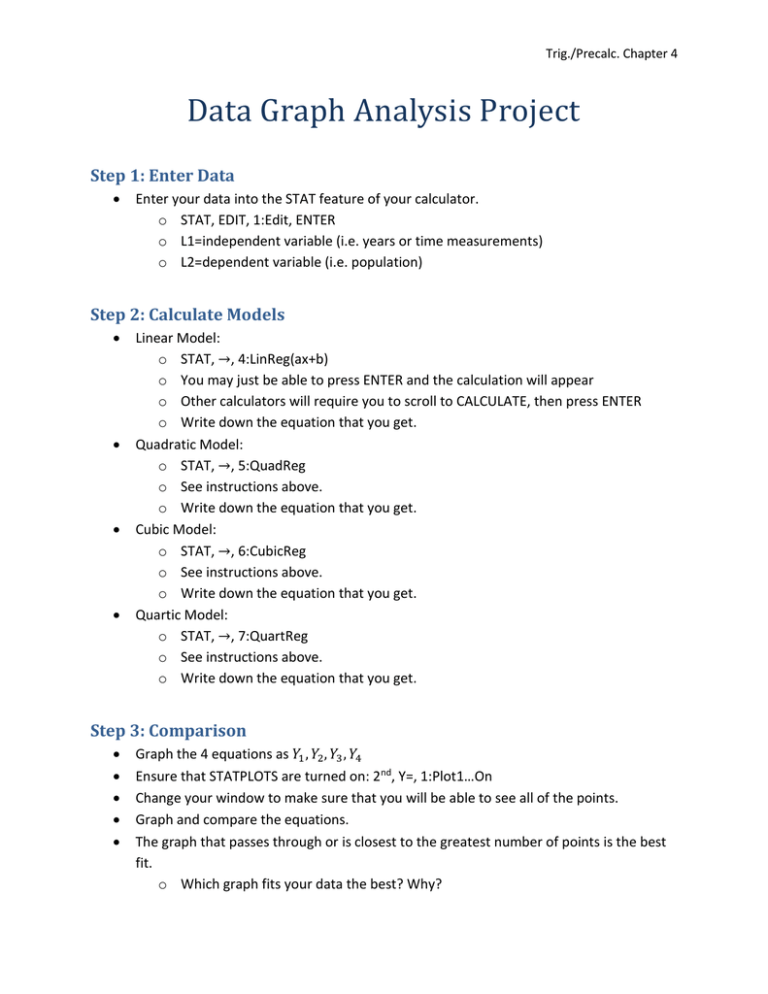
Trig./Precalc. Chapter 4 Data Graph Analysis Project Step 1: Enter Data Enter your data into the STAT feature of your calculator. o STAT, EDIT, 1:Edit, ENTER o L1=independent variable (i.e. years or time measurements) o L2=dependent variable (i.e. population) Step 2: Calculate Models Linear Model: o STAT, →, 4:LinReg(ax+b) o You may just be able to press ENTER and the calculation will appear o Other calculators will require you to scroll to CALCULATE, then press ENTER o Write down the equation that you get. Quadratic Model: o STAT, →, 5:QuadReg o See instructions above. o Write down the equation that you get. Cubic Model: o STAT, →, 6:CubicReg o See instructions above. o Write down the equation that you get. Quartic Model: o STAT, →, 7:QuartReg o See instructions above. o Write down the equation that you get. Step 3: Comparison Graph the 4 equations as 𝑌1 , 𝑌2 , 𝑌3 , 𝑌4 Ensure that STATPLOTS are turned on: 2nd, Y=, 1:Plot1…On Change your window to make sure that you will be able to see all of the points. Graph and compare the equations. The graph that passes through or is closest to the greatest number of points is the best fit. o Which graph fits your data the best? Why? Trig./Precalc. Chapter 4 o Draw this graph and the data points to demonstrate your conclusion. o Explain what this best fit model would allow you to do in the context of your data set. (i.e. This model would allow me to predict the future population of California by substituting year values for x. Etc.) Step 4: Write-Up You will need to include the following parts of the project on a separate piece of paper: Your set of data 4 equations Graph of your data points, and best fit equation Answers to the questions in Step 3


