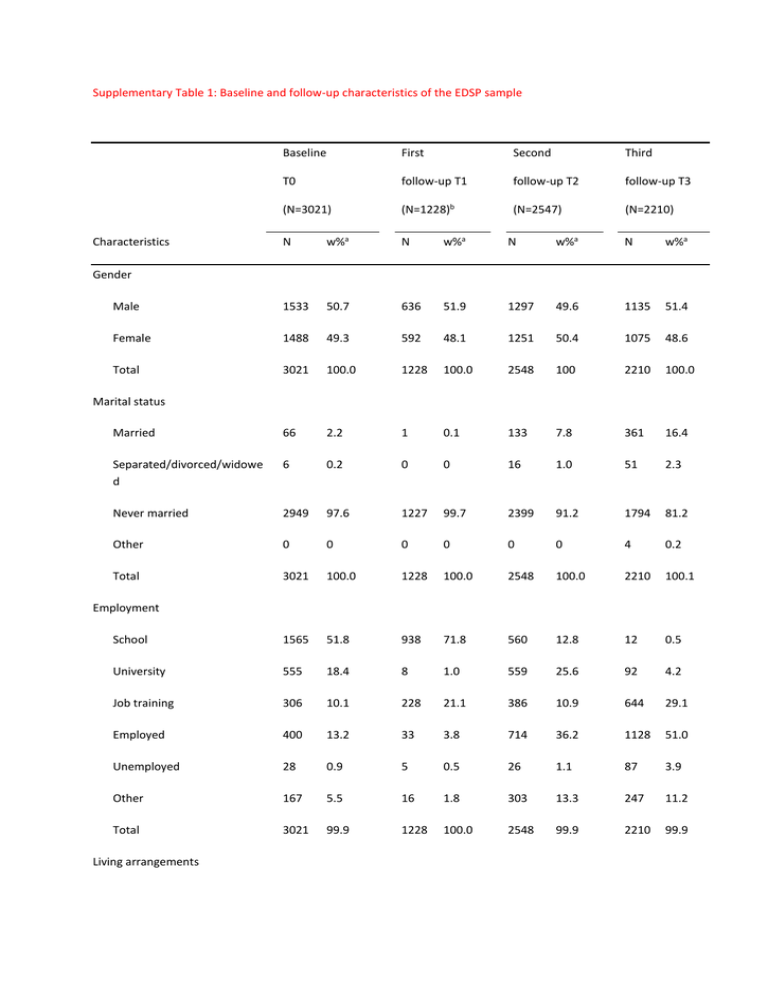
Supplementary Table 1: Baseline and follow-up characteristics of the EDSP... Baseline First
advertisement

Supplementary Table 1: Baseline and follow-up characteristics of the EDSP sample Baseline First Second Third T0 follow-up T1 follow-up T2 follow-up T3 (N=3021) (N=1228)b (N=2547) (N=2210) N w%a N w%a N w%a N w%a Male 1533 50.7 636 51.9 1297 49.6 1135 51.4 Female 1488 49.3 592 48.1 1251 50.4 1075 48.6 Total 3021 100.0 1228 100.0 2548 100 2210 100.0 Married 66 2.2 1 0.1 133 7.8 361 16.4 Separated/divorced/widowe d 6 0.2 0 0 16 1.0 51 2.3 Never married 2949 97.6 1227 99.7 2399 91.2 1794 81.2 Other 0 0 0 0 0 0 4 0.2 Total 3021 100.0 1228 100.0 2548 100.0 2210 100.1 School 1565 51.8 938 71.8 560 12.8 12 0.5 University 555 18.4 8 1.0 559 25.6 92 4.2 Job training 306 10.1 228 21.1 386 10.9 644 29.1 Employed 400 13.2 33 3.8 714 36.2 1128 51.0 Unemployed 28 0.9 5 0.5 26 1.1 87 3.9 Other 167 5.5 16 1.8 303 13.3 247 11.2 Total 3021 99.9 1228 100.0 2548 99.9 2210 99.9 Characteristics Gender Marital status Employment Living arrangements With parents 2196 72.7 1186 95.3 1368 40.2 395 17.9 Alone 446 14.8 17 1.9 509 25.7 634 27.7 With partner 306 10.1 10 1.4 421 22.7 953 44.1 Other 73 2.4 15 1.5 250 11.4 228 10.3 Total 3021 100.0 1228 100.1 2548 100.0 2210 100.0 Very bad, bad 213 7.1 52 4.6 151 6.7 222 10.1 Neither good nor bad 830 27.5 314 26.3 738 28.6 667 30.2 Good 1633 54.1 695 55.6 1367 53.4 1085 49.1 Very good 345 11.4 165 13.6 269 10.4 236 10.7 No information 0 0 2 0.2 23 1.0 0 0 Total 3021 100.1 1228 100.0 2548 100.1 2210 100.1 Lowest 24 1.0 4 0.4 14 0.5 21 1.0 Lower middle 183 6.6 65 5.6 230 9.8 280 12.6 Middle 1804 59.1 693 56.2 1524 60.2 1312 59.6 Upper middle 854 28.3 438 35.6 682 25.6 545 24.5 Upper 96 3.2 19 1.6 53 2.0 36 1.6 No information 60 1.9 9 0.7 45 2.0 16 0.7 Total 3021 100.1 1228 100.1 2548 100.1 2210 100.0 Financial Situation Social classc w%, Weighted percent; a. Percentages are rounded and therefore can summarize to slightly fewer or more than 100.0 percent; b. Only the younger cohort (aged 14-17 years) was assessed; c. Subjective rating by the participant Supplementary Table 2: Reporting patterns of traumatic episodes by assessment wave Frequencies Percent Cumulated Percent Reporting patterns % T0 T1 T2 N % 163 25.47 25.47 111 17.34 42.81 90 14.06 56.88 49 7.66 64.53 40 6.25 70.78 39 6.09 76.88 37 5.78 82.66 37 5.78 88.44 13 2.03 90.47 61 9.54 100 ANY OTHERS 640 100,00 T3 Baseline T0 First Follow-up T1 Second Follow-up T2 Third Follow-up T3 Total N=2548, 14-17 year olds N=1169, 18-24 year olds N=1379 Total N=2210, 14-17 years N=1022, 18-24 years N=1188 Total sample N=3021 14-17 years N=1395 18-24 years N=1626 Only baseline 14-17 year olds N=1228 1995 1996/-97 1998/-99 2003/-04/-05 R =70.9% R1=74.3% R2=68.1% R1=88.0% R =84.3% R1=83.8% R2=84.8% R =73.2% R1=73.3% R2=73.1% t Note: R = response rate R1 = response rate among baseline 14-17 year olds R2 = response rate among baseline 18-24 year olds Supplementary Fig. 1: Assessment times and response rates of the EDSP sample


