Recognition of Numbers
advertisement

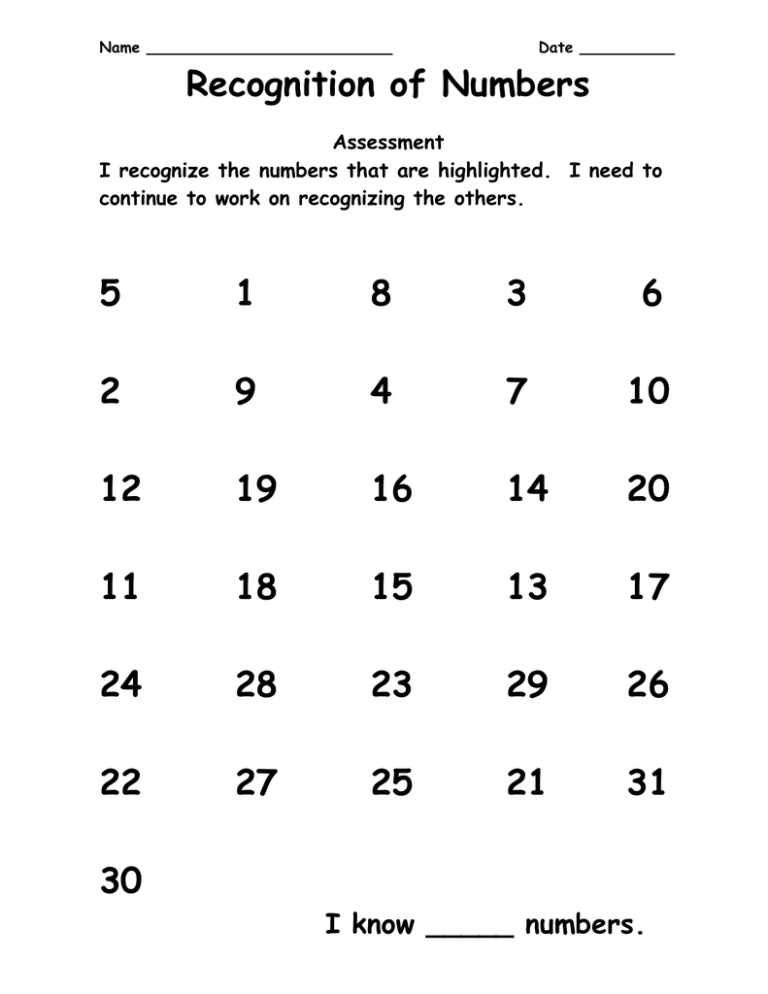
Name __________________________ Date __________ Recognition of Numbers Assessment I recognize the numbers that are highlighted. I need to continue to work on recognizing the others. 5 1 8 3 6 2 9 4 7 10 12 19 16 14 20 11 18 15 13 17 24 28 23 29 26 22 27 25 21 31 30 I know _____ numbers. Recognition of Numbers Number I can count up to consecutively Goal: My goal is to be able to count up to 20. 20 19 18 17 16 15 14 13 12 11 10 9 8 7 6 5 4 3 2 1 Date tested Date tested Date tested Dates Tested Recognition Data Goal: My goal is to know all of my numbers (1:1 correspondence) Directions: Shade in the numbers that you can identify (1:1 correspondence) 1 2 3 4 5 6 7 8 9 10 11 12 Numbers 13 14 15 16 17 18 19 20 21 22 23 24 Name __________________________ Date __________ Counting I can count to… 1 2 3 4 5 6 7 8 9 10 11 12 13 14 15 16 17 18 19 20 21 22 23 24 25 26 27 28 29 30 31 32 33 34 35 36 37 38 39 40 41 42 43 44 45 46 47 48 49 50 51 52 53 54 55 56 57 58 59 60 61 62 63 64 65 66 67 68 69 70 71 72 73 74 75 76 77 78 79 80 81 82 83 84 85 86 87 88 89 90 91 92 93 94 95 96 97 98 99 100 = September = March = January = June Name __________________ Teachers name ____________________ Date Assignment Grade What are you going to do to improve? Basic Facts 20 19 18 17 16 15 14 13 Number Correct 12 11 10 9 8 7 6 5 4 3 2 1 0 Test Test Test Test Test Test Test Test Test Date Fact Test Test Test Test Test Test Test Test Basic Facts 40 38 36 34 32 30 28 26 24 Number Correct 22 20 18 16 14 12 10 8 6 4 2 0 Test Test Test Test Test Test Test Test Test Date Fact Test Test Test Test Test Test Test Test BCR Data BCR concept Grade on First Answer Grade on Rewrite 0 1 2 0 1 2 0 1 2 0 1 2 0 1 2 0 1 2 0 1 2 0 1 2 0 1 2 0 1 2 0 1 2 0 1 2 0 1 2 0 1 2 0 1 2 0 1 2 0 1 2 0 1 2 0 1 2 0 1 2 0 1 2 0 1 2 0 1 2 0 1 2 0 1 2 0 1 2 0 1 2 0 1 2 0 1 2 0 1 2 0 1 2 0 1 2 0 1 2 0 1 2 0 1 2 0 1 2 My Shark Math Data Final 6-9’s 9’s 8’s 7’s 6’s 2-5’s 5’s 4’s 3’s 2’s February March April May June My Math Data (Scattergram) Advanced Proficient Developing Minimal (0-50 pts) Level of Understanding I can express two-three digit numbers in expanded notation. I can interpret data from tally charts, pictographs, and bar graphs in terms of more, less, and equal. I can organize and display data in more than one way. I can gather and organize data from surveys and classroom experiments. I can use patterns to continue numerical sequences and identify the rule. I can recognize, describe, extend, and create repeating and increasing patterns using models and numbers. I can read and write words that represent less than 1,000. I can model multi-digit numbers. I can use, model, and label place value positions of 1’a, 10’s, and 100’s. I can generalize ways to determine even and odd. I can apply place value concepts and us symbols (,.). I can compare and order whole numbers less than 1,000. I can identify and use 10 more and 10 less. I can identify missing numbers in a sequence to 100. My Math Data Dear Parents and students, During the next unit of study, we will be focusing on the following objectives. Our goal is obtain complete mastery of each objective. We will be monitoring our learning, analyzing our results, and developing action plans on a continuous basis to ensure that we are making progress and reaching our grade level goal(s). Summative Data Sheet Mastery Objective Minimal Developing Proficient Advanced I can identify missing numbers in a sequence to 100. I can identify and use 10 more and 10 less. I can compare and order whole numbers less than 1,000. I can apply place value concepts and use symbols. I can use, model, and label place value positions of 1’s, 10’s, and 100’s. I can model multi-digit numbers. I can read and write words that represent less than 1,000. I can express tow-three digit numbers in expanded notation. I can recognize, describe, extend, and compare repeating patterns using models and numbers. I can use patterns to continue numerical sequences and identify the rule. I can gather information and organize data from surveys and classroom experiments. I can organize and display data in more than one way. I can interpret data from: Tally Charts Pictographs Bar graphs (more, less, equal) Multiplication Scattergram 100 90 80 Percentage 70 60 50 40 30 20 10 0 10 20 30 40 Minutes Time spent study this week (self-rating) 50-60

