COCOMO II/Chapter 4 tables/Boehm et al.
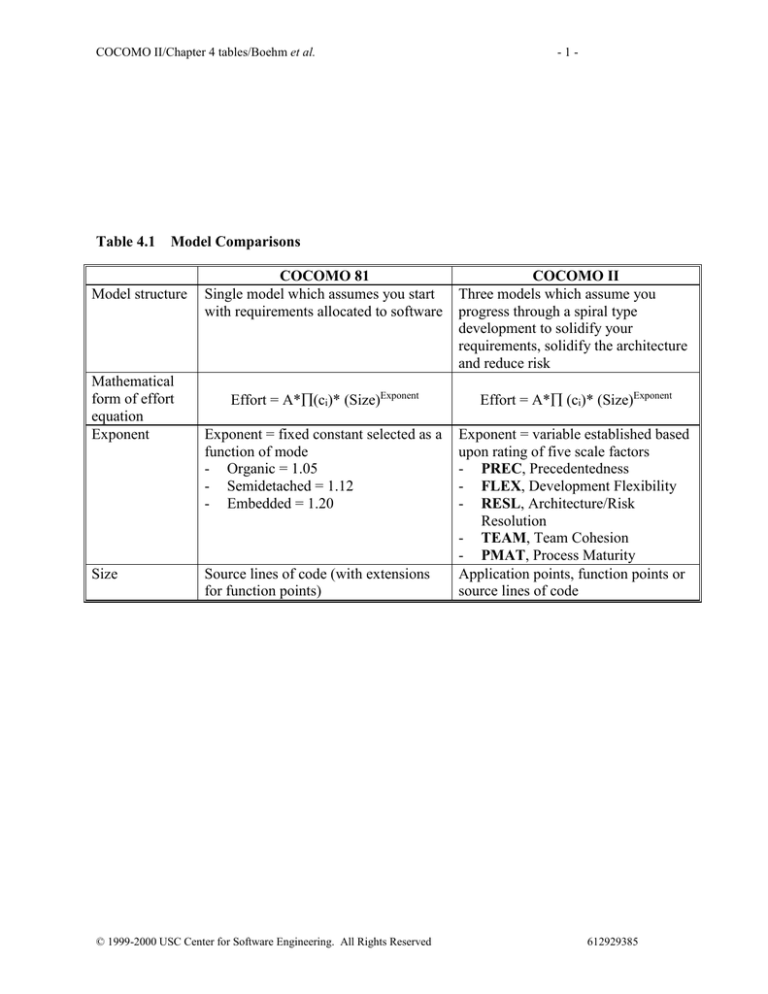
Table 4.1
Model Comparisons
Model structure
Mathematical
form of effort
equation
Exponent
Size
-1-
COCOMO 81
Single model which assumes you start
with requirements allocated to software
COCOMO II
Three models which assume you
progress through a spiral type
development to solidify your
requirements, solidify the architecture
and reduce risk
Effort = A*(ci)* (Size)Exponent
Effort = A* (ci)* (Size)Exponent
Exponent = fixed constant selected as a
function of mode
- Organic = 1.05
- Semidetached = 1.12
- Embedded = 1.20
Exponent = variable established based
upon rating of five scale factors
- PREC, Precedentedness
- FLEX, Development Flexibility
- RESL, Architecture/Risk
Resolution
- TEAM, Team Cohesion
- PMAT, Process Maturity
Application points, function points or
source lines of code
Source lines of code (with extensions
for function points)
© 1999-2000 USC Center for Software Engineering. All Rights Reserved
612929385
COCOMO II/Chapter 4 tables/Boehm et al.
Table 4.1
-2-
(Cont'd)
Cost
Drivers (ci)
Fifteen drivers each of which must be
rated:
- RELY, Reliability
- DATA, Data Base Size
- CPLX, Complexity
- TIME, Execution Time Constraint
- STOR, Main Storage Constraint
- VIRT, Virtual Machine Volatility
- TURN, Turnaround Time
- ACAP, Analyst Capability
- PCAP, Programmer Capability
- AEXP, Applications Experience
- VEXP, Virt. Machine Experience
- LEXP, Language Experience
- TOOL, Use of Software Tools
- MODP, Use of Modern
Programming Techniques
- SCED, Required Schedule
Other model
differences
Model based upon:
- Linear reuse formula
- Assumption of reasonably stable
requirements
© 1999-2000 USC Center for Software Engineering. All Rights Reserved
Seventeen drivers each of which must
be rated
- RELY, Reliability
- DATA, Data Base Size
- CPLX, Complexity
- RUSE, Develop for Reusability
- DOCU, Documentation
- TIME, Execution Time Constraint
- STOR, Main Storage Constraint
- PVOL, Platform Volatility
- ACAP, Analyst Capability
- PCAP, Programmer Capability
- APEX, Applications Experience
- PCON, Personnel Continuity
- PLEX, Platform Experience
- LTEX, Language & Tool
Experience
- TOOL, Use of Software Tools
- SITE, Multi-site Development
- SCED, Required Schedule
Has many other enhancements
including:
- Non-linear reuse formula
- Reuse model which looks at effort
needed to understand and
assimilate
- Ratings which are used to address
requirements volatility
612929385
COCOMO II/Chapter 4 tables/Boehm et al.
Table 4.2
-3-
Converting Size Estimates
COCOMO 81
DSI
- 2nd generation languages
- 3rd generation languages
- 4th generation languages
- object-oriented languages
Function points
Feature points
COCOMO II
SLOC
- reduce DSI by 35%
- reduce DSI by 25%
- reduce DSI by 40%
- reduce DSI by 30%
Use the expansion factors developed by Capers
Jones [refer to http://www.spr.com for the latest set] to
determine equivalent SLOC's
Use the expansion factors developed by Capers
Jones [refer to http://www.spr.com for the latest set] to
determine equivalent SLOC's
© 1999-2000 USC Center for Software Engineering. All Rights Reserved
612929385
COCOMO II/Chapter 4 tables/Boehm et al.
-4-
Table 4.3 Mode/Scale Factor Conversion Ratings
MODE/SCALE FACTORS
Precedentedness (PREC)
Development flexibility (FLEX)
Architecture/risk resolution (RESL)
Team cohesion (TEAM)
Process maturity (PMAT)
ORGANIC
XH
XH
XH
XH
f(MODP)
© 1999-2000 USC Center for Software Engineering. All Rights Reserved
SEMIDETACHED
H
H
H
VH
f(MODP)
EMBEDDED
L
L
L
N
f(MODP)
612929385
COCOMO II/Chapter 4 tables/Boehm et al.
Table 4.4
-5-
Cost Drivers Conversions
COCOMO 81
DRIVERS
RELY
DATA
CPLX
TIME
STOR
VIRT
TURN
ACAP
PCAP
AEXP
COCOMO II
DRIVERS
RELY
DATA
CPLX
TIME
STOR
PVOL
VEXP
LEXP
TOOL
MODP
PLEX
LTEX
TOOL
Adjust PMAT
settings
SCED
SCED
RUSE
DOCU
ACAP
PCAP
APEX
PCON
SITE
CONVERSION
FACTORS
None, rate the same or the actual
None, rate the same or the actual
None, rate the same or the actual
None, rate the same or the actual
None, rate the same or the actual
None, rate the same or the actual
Use values in Table 4.5
None, rate the same or the actual
None, rate the same or the actual
Use next-highest rating. 1-year AEXP was rated L;
for COCOMO II APEX 1 year is rated N. VH
stays VH.
None, rate the same or the actual
None, rate the same or the actual
Use values in Table 4.5
If MODP is rated VL or L, set PMAT to VL
N, set PMAT to L
H or VH, set PMAT to N
None, rate the same or the actual
Set to N, or actual if available
If Mode = Organic, set to L
= Semidetached, set to N
= Embedded, set to H
Set to N, or actual if available
Set to H, or actual if available
© 1999-2000 USC Center for Software Engineering. All Rights Reserved
612929385
COCOMO II/Chapter 4 tables/Boehm et al.
Table 4.5
-6-
TURN and TOOL Adjustments
COCOMO II MULTIPLIER
ADJUSTMENT / COCOMO 81 RATING
TURN
TOOL
VL
L
N
H
VH
VL*1.24
1.00
VL*1.10
1.15
VL
1.23
L
1.32
N
© 1999-2000 USC Center for Software Engineering. All Rights Reserved
612929385
COCOMO II/Chapter 4 tables/Boehm et al.
Table 4.6
-7-
Estimate Accuracy Analysis Results
CASES
Using the COCOMO II model as calibrated
Using the COCOMO II model as calibrated using
developer or domain clustering
Using Rosetta Stone with no adjustments
Using the Rosetta Stone with knowledge base adjustments
Using the Rosetta Stone with knowledge base adjustments
and domain clustering
© 1999-2000 USC Center for Software Engineering. All Rights Reserved
ACCURACY
Estimates within 25% of actuals,
68% of the time
Estimates within 25% of actuals,
76% of the time
Estimates within 25% of actuals,
60% of the time
Estimates within 25% of actuals,
68% of the time
Estimates within 25% of actuals,
74% of the time
612929385
COCOMO II/Chapter 4 tables/Boehm et al.
Table 4.7
-8-
COCOMO II.1997 Highly Correlated Parameters
TIME
STOR
ACAP
TIME
1.0000
STOR
0.6860
1.0000
ACAP
-0.2855
-0.0769
1.0000
PCAP
-0.2015
-0.0027
0.7339
Legend:
PCAP
New Parameter
RCON
PERS
1.0000
TIME (Timing Constraints)
STOR (Storage Constraints)
RCON (Resource Constraints)
ACAP (Analyst Capability)
PCAP (Programmer Capability)
PERS (Personnel Capability)
© 1999-2000 USC Center for Software Engineering. All Rights Reserved
612929385
COCOMO II/Chapter 4 tables/Boehm et al.
Table 4.8
-9-
Regression Run Using 1997 Dataset
Data set = COCOMOII.1997
Response = log[PM] - 1.01*log[SIZE]
Coefficient Estimates
Label
Constant_A
PMAT*log[SIZE]
PREC*log[SIZE]
TEAM*log[SIZE]
FLEX*log[SIZE]
RESL*log[SIZE]
log[PERS]
log[RELY]
log[CPLX]
log[RCON]
Estimate
0.701883
0.000884288
-0.00901971
0.00866128
0.0314220
-0.00558590
0.987472
0.798808
1.13191
1.36588
Std. Error
0.231930
0.0130658
0.0145235
0.0170206
0.0151538
0.019035
0.230583
0.528549
0.434550
0.273141
t-value
3.026
0.068
-0.621
0.509
2.074
-0.293
4.282
1.511
2.605
5.001
log[PLEX]
0.696906
0.527474
1.321
log[LTEX]
log[DATA]
log[RUSE]
log[DOCU]
log[PVOL]
log[APEX]
log[PCON]
log[TOOL]
-0.0421480
2.52796
-0.444102
-1.32818
0.858302
0.560542
0.488392
2.49512
0.672890
0.723645
0.486480
0.664557
0.532544
0.609259
0.322021
1.11222
-0.063
3.493
-0.913
-1.999
1.612
0.920
1.517
2.243
log[SITE]
1.39701
0.831993
1.679
log[SCED]
2.84074
0.774020
3.670
© 1999-2000 USC Center for Software Engineering. All Rights Reserved
612929385
COCOMO II/Chapter 4 tables/Boehm et al.
Table 4.9a
- 10 -
RUSE – Expert-determined a priori rating scale, consistent with 12
published studies
Develop for Reusability
(RUSE)
Low (L)
Nominal (N)
High (H)
Very High (VH)
Extra High
(XH)
Definition
None
1997 A priori Values
0.89
Across
project
1.00
Across
program
1.16
Across product
line
1.34
Across multiple
product lines
1.56
© 1999-2000 USC Center for Software Engineering. All Rights Reserved
612929385
COCOMO II/Chapter 4 tables/Boehm et al.
Table 4.9b
- 11 -
RUSE – Data-determined rating scale, contradicting 12 published
studies
Develop for Reusability
(RUSE)
Low (L)
Nominal (N)
High (H)
Very High (VH)
Extra High
(XH)
Definition
None
1997 Data-Determined
Values
1.05
Across
project
1.00
Across
program
0.94
Across product
line
0.88
Across multiple
product lines
0.82
© 1999-2000 USC Center for Software Engineering. All Rights Reserved
612929385
COCOMO II/Chapter 4 tables/Boehm et al.
Table 4.10
- 12 -
COCOMO II.1997 Values
Driver
Symbol
VL
PREC
SF1
0.0405
FLEX
SF2
0.0607
RESL
SF3
0.0422
TEAM
SF4
0.0494
PMAT
SF5
0.0454
RELY
EM1
0.75
DATA
EM2
RUSE
EM3
DOCU
EM4
0.89
CPLX
EM5
0.75
TIME
EM6
STOR
EM7
PVOL
EM8
ACAP
EM9
1.50
PCAP
EM10
1.37
PCON
EM11
1.24
APEX
EM12
1.22
PLEX
EM13
1.25
LTEX
EM14
1.22
TOOL
EM15
1.24
SITE
EM16
1.25
SCED
EM17
1.29
For Effort Calculations:
Multiplicative constant A = 2.45;
Exponential constant B = 1.01
L
0.0324
0.0486
0.0338
0.0395
0.0364
0.88
0.93
0.91
0.95
0.88
N
H
VH
0.0243 0.0162 0.0081
0.0364 0.0243 0.0121
0.0253 0.0169 0.0084
0.0297 0.0198 0.0099
0.0273 0.0182 0.0091
1.00
1.15
1.39
1.00
1.09
1.19
1.00
1.14
1.29
1.00
1.06
1.13
1.00
1.15
1.30
1.00
1.11
1.31
1.00
1.06
1.21
0.87
1.00
1.15
1.30
1.22
1.00
0.83
0.67
1.16
1.00
0.87
0.74
1.10
1.00
0.92
0.84
1.10
1.00
0.89
0.81
1.12
1.00
0.88
0.81
1.10
1.00
0.91
0.84
1.12
1.00
0.86
0.72
1.10
1.00
0.92
0.84
1.10
1.00
1.00
1.00
For Schedule Calculations:
Multiplicative constant A = 2.66;
Exponential constant B = 0.33
© 1999-2000 USC Center for Software Engineering. All Rights Reserved
XH
0.00
0.00
0.00
0.00
0.00
1.49
1.66
1.67
1.57
0.78
612929385
COCOMO II/Chapter 4 tables/Boehm et al.
Table 4.11
- 13 -
Prediction Accuracy of COCOMO II.1997
COCOMO
II.1997
PRED(.20)
PRED(.25)
PRED(.30)
Before Stratification by
Organization
46%
49%
52%
© 1999-2000 USC Center for Software Engineering. All Rights Reserved
After Stratification by
Organization
49%
55%
64%
612929385
COCOMO II/Chapter 4 tables/Boehm et al.
Table 4.12
Develop for
Reusability
(RUSE)
Definition
COCOMO II.2000
A-priori Values
- 14 -
COCOMO II.2000 “A-Priori” Rating Scale for Develop for
Reusability (RUSE)
Productivity
Range
Low
(L)
Nominal
(N)
High
(H)
Very High
VH)
Extra High
(XH)
Least
Productive
Rating / Most
Productive
Rating
Mean = 1.73
Variance =
0.05
None
Across
project
Across
program
Across
product
line
Across
multiple
product
lines
0.89
1.0
1.15
1.33
1.54
© 1999-2000 USC Center for Software Engineering. All Rights Reserved
612929385
COCOMO II/Chapter 4 tables/Boehm et al.
Table 4.13
- 15 -
Regression Run Using 2000 Dataset
Data set = COCOMO II.2000
Response
= log[PM]
Coefficient Estimates
Label
Estimate
Std. Error
t-value
Constant_A
0.961552
0.103346
9.304
log[SIZE]
0.921827
0.0460578
20.015
PMAT*log[SIZE]
0.684836
0.481078
1.424
PREC*log[SIZE]
1.10203
0.373961
2.947
TEAM*log[SIZE]
0.323318
0.497475
0.650
FLEX*log[SIZE]
0.354658
0.686944
0.516
RESL*log[SIZE]
1.32890
0.637678
2.084
log[PCAP]
1.20332
0.307956
3.907
log[RELY]
0.641228
0.246435
2.602
log[CPLX]
1.03515
0.232735
4.448
log[TIME]
1.58101
0.385646
4.100
log[STOR]
0.784218
0.352459
2.225
log[ACAP]
0.926205
0.272413
3.400
log[PLEX]
0.755345
0.356509
2.119
log[LTEX]
0.171569
0.416269
0.412
log[DATA]
0.783232
0.218376
3.587
log[RUSE]
-0.339964
0.286225
-1.188
log[DOCU]
2.05772
0.622163
3.307
log[PVOL]
0.867162
0.227311
3.815
log[APEX]
0.137859
0.330482
0.417
log[PCON]
0.488392
0.322021
1.517
log[TOOL]
0.551063
0.221514
2.488
log[SITE]
0.674702
0.498431
1.354
log[SCED]
1.11858
0.275329
4.063
© 1999-2000 USC Center for Software Engineering. All Rights Reserved
612929385
COCOMO II/Chapter 4 tables/Boehm et al.
Table 4.14
Driver
PREC
FLEX
RESL
TEAM
PMAT
RELY
DATA
CPLX
RUSE
DOCU
TIME
STOR
PVOL
ACAP
PCAP
PCON
APEX
PLEX
LTEX
TOOL
SITE
SCED
- 16 -
COCOMO II.2000 Values
Symbol
SF1
SF2
SF3
SF4
SF5
EM1
EM2
EM3
EM4
EM5
EM6
EM7
EM8
EM9
EM10
EM11
EM12
EM13
EM14
EM15
EM16
EM17
VL
6.20
5.07
7.07
5.48
7.80
0.82
0.73
0.81
1.42
1.34
1.29
1.22
1.19
1.20
1.17
1.22
1.43
For Effort Calculations:
Multiplicative constant A = 2.94;
Exponential constant B = 0.91
L
4.96
4.05
5.65
4.38
6.24
0.92
0.90
0.87
0.95
0.91
0.87
1.19
1.15
1.12
1.10
1.09
1.09
1.09
1.09
1.14
N
3.72
3.04
4.24
3.29
4.68
1.00
1.00
1.00
1.00
1.00
1.00
1.00
1.00
1.00
1.00
1.00
1.00
1.00
1.00
1.00
1.00
1.00
H
2.48
2.03
2.83
2.19
3.12
1.10
1.14
1.17
1.07
1.11
1.11
1.05
1.15
0.85
0.88
0.90
0.88
0.91
0.91
0.90
0.93
1.00
VH
1.24
1.01
1.41
1.10
1.56
1.26
1.28
1.34
1.15
1.23
1.29
1.17
1.30
0.71
0.76
0.81
0.81
0.85
0.84
0.78
0.86
1.00
XH
0.00
0.00
0.00
0.00
0.00
1.74
1.24
1.63
1.46
0.80
For Schedule Calculations:
Multiplicative constant A = 3.67;
Exponential constant B = 0.28
© 1999-2000 USC Center for Software Engineering. All Rights Reserved
612929385
COCOMO II/Chapter 4 tables/Boehm et al.
- 17 -
Table 4.15
Prediction Accuracies of Bayesian A-Posteriori
COCOMOII.2000 Before and After Stratification
Prediction Accuracy
Bayesian A-Posteriori COCOMO II.2000
Before
After
PRED(.20)
63%
70%
PRED(.25)
68%
76%
PRED(.30)
75%
80%
© 1999-2000 USC Center for Software Engineering. All Rights Reserved
612929385
COCOMO II/Chapter 4 tables/Boehm et al.
- 18 -
Table 4.16
Prediction Accuracies Using the Pure-Regression, the 10%
Weighted-Average Multiple-Regression and the Bayesian Based Models
Calibrated Using the 1997 dataset of 83 datapoints and Validated Against 83
and 161 datapoints
Prediction
Accuracy
PRED(.20)
PRED(.25)
PRED(.30)
Calibrated Using 83 datapoints
Pure-Regression
COCOMO II.1997 - 10%
Bayesian Approach
Based Model
Weighted-Average Based
Based Model
(Model A)
Model (Model B)
(Model C)
83
49%
63%
64%
Number of datapoints used to validated
161
83
161
83
31%
46%
54%
41%
39%
49%
59%
53%
44%
52%
63%
58%
© 1999-2000 USC Center for Software Engineering. All Rights Reserved
161
54%
62%
66%
612929385
COCOMO II/Chapter 4 tables/Boehm et al.
Table 4.17
- 19 -
Calibrating the Multiplicative Constant to Project Data
Project Number (i)
1
2
3
4
5
6
7
8
PMi
1854.55
258.51
201.00
58.87
9661.02
7021.28
91.67
689.66
kSLOCi
134.47
132
44.03
3.57
380.8
980
11.186
61.56
EMi
1.89
0.49
1.06
5.05
3.05
0.92
2.45
2.38
© 1999-2000 USC Center for Software Engineering. All Rights Reserved
SFi
29.28
16.72
22.48
18.19
26.77
25.21
23.5
26.48
Efforti
2014.04
278.777
227.996
59.56684
9819.961
8092.762
114.2832
886.2177
612929385
COCOMO II/Chapter 4 tables/Boehm et al.
Table 4.18
- 20 -
Regression Run: Calibrating Multiplicative Constant to Project Data
Data set = Local_Calibration_A, Name of Model = L1
Normal Regression Model
Mean function = Identity
Response
= ln[Effort]-(0.91*ln[Size]+1*SF1* ln[Size] + 2*SF2* ln[Size]+…+ +5*SF5*
ln[Size]+6*ln[EM1]+7*ln[EM2]+…+ 22*ln[EM22])
Predictors = 0
With no intercept.
Coefficient Estimates
Label
Estimate
Std. Error
t-value
0.962733
0.0308810
31.176
0
Sigma hat
0.0873447
Number of cases
8
Degrees of freedom
7
Summary Analysis of Variance Table
Source
df
SS
MS
F
Regression
1
7.41483
7.41483
971.91
Residual
7
0.0534037
0.0076291
Pure Error
7
0.0534037
0.0076291
© 1999-2000 USC Center for Software Engineering. All Rights Reserved
612929385
COCOMO II/Chapter 4 tables/Boehm et al.
Table 4.19
- 21 -
Improvement in Accuracy of COCOMO II.2000 Using Locally
Calibrated Multiplicative Constant, A
Project
PMi
Efforti Using
Error Using
Efforti Using
Number (I)
COCOMO II.2000 COCOMO II.2000
Local A
0.09
1794.00
1
1854.55
2014.04
0.08
248.32
2
258.51
278.777
0.13
203.09
3
201.00
227.996
0.01
53.06
4
58.87
59.56684
0.02
8747.11
5
9661.02
9819.961
0.15
7208.61
6
7021.28
8092.762
0.25
101.80
7
91.67
114.2832
0.29
789.40
8
689.66
886.2177
© 1999-2000 USC Center for Software Engineering. All Rights Reserved
Error Using
Local A
0.03
0.04
0.01
0.10
0.09
0.03
0.11
0.14
612929385
COCOMO II/Chapter 4 tables/Boehm et al.
Table 4.20
COCOMO
II.2000
PRED(.20)
PRED(.25)
PRED(.30)
- 22 -
Prediction Accuracy of COCOMO II.2000
Before Stratification by
Organization
63%
68%
75%
© 1999-2000 USC Center for Software Engineering. All Rights Reserved
After Stratification by
Organization
70%
76%
80%
612929385
COCOMO II/Chapter 4 tables/Boehm et al.
Table 4.21
COCOMO
II.2000
PRED (.20)
PRED (.25)
PRED (.30)
- 23 -
Schedule Prediction Accuracy of COCOMO II.2000
Before Stratification by
Organization
50%
55%
64%
© 1999-2000 USC Center for Software Engineering. All Rights Reserved
After Stratification by
Organization
50%
67%
75%
612929385
COCOMO II/Chapter 4 tables/Boehm et al.
Table 4.22
- 24 -
Regression Run: Calibrating Multiplicative and Exponential
Constants to Project Data
Data set = Local_Calibration_A_and_B, Name of Model = L2
Normal Regression Model
Mean function = Identity
Response
= ln[Effort]-(1*SF1* ln[Size] +2*SF2* ln[Size]+…+ +5*SF5*
ln[Size]+6*ln[EM1]+7*ln[EM2]+…+ 22*ln[EM22])
Predictors = (0*1* ln[Size])
Coefficient Estimates
Label
Estimate
Std. Error
0.953288
0.0902335
0
0.912210
0.0196111
1
R Squared
0.997235
Sigma hat
0. 0942695
Number of cases
8
Degrees of freedom
6
Summary Analysis of Variance Table
Source
df
SS
MS
Regression
1
19.2277
19.2277
Residual
6
0.0533205
0.00888675
© 1999-2000 USC Center for Software Engineering. All Rights Reserved
t-value
10.565
46.515
F
2163.63
612929385
COCOMO II/Chapter 4 tables/Boehm et al.
Table 4.23
- 25 -
Improvement in Accuracy of COCOMO II.2000 Using Locally
Calibrated Constants, A and B
Project
PMi Efforti Using Error Using
Number
COCOMO COCOMO
(i)
II.2000
II.2000
1
1854.55
2014.04
0.09
2
258.51
278.777
0.08
3
201.00
227.996
0.13
4
58.87 59.56684
0.01
5
9661.02 9819.961
0.02
6
7021.28 8092.762
0.15
7
91.67 114.2832
0.25
8
689.66 886.2177
0.29
Efforti Using
Error
Efforti Using Error Using
Local A
Using Local Local A and B
Local A
A
1794.00
0.03
1791.75
0.03
248.32
0.04
248.00
0.04
203.09
0.01
202.38
0.01
53.06
0.10
52.61
0.11
8747.11
0.09
8754.34
0.09
7208.61
0.03
7228.22
0.03
101.80
0.11
101.17
0.10
789.40
0.14
787.18
0.14
© 1999-2000 USC Center for Software Engineering. All Rights Reserved
612929385
COCOMO II/Chapter 4 tables/Boehm et al.
Table 4.24
- 26 -
Consolidating Analyst Capability and Programmer Capability
Capability Scale
VL
L
N
H
VH
ACAP
1.42
1.19
1.0
0.85
0.71
PCAP
1.34
1.15
1.0
0.88
0.76
© 1999-2000 USC Center for Software Engineering. All Rights Reserved
PERS = ACAP*PCAP
1.90
1.37
1.0
0.75
0.54
612929385

