Dist. 2
Commodity Data Sheet
Pears
Extension Economic Information Office
Oregon State University
213 Ballard Extension Hall
Corvallis, OR 97331-3601
(541) 737-1436
District
4
District
1
Dist.
2
District
6
District
3
Commodity numbers-year: 5125, 5127, 5130-09*
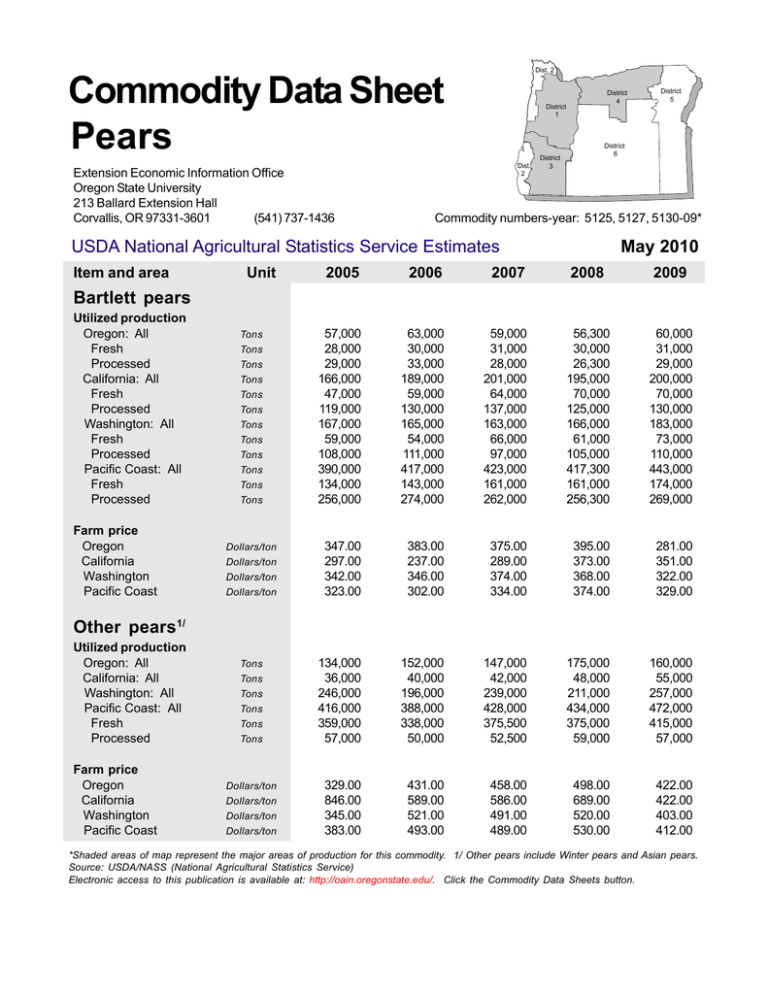
USDA National Agricultural Statistics Service Estimates
Item and area
Unit
District
5
May 2010
2005
2006
2007
2008
2009
57,000
28,000
29,000
166,000
47,000
119,000
167,000
59,000
108,000
390,000
134,000
256,000
63,000
30,000
33,000
189,000
59,000
130,000
165,000
54,000
111,000
417,000
143,000
274,000
59,000
31,000
28,000
201,000
64,000
137,000
163,000
66,000
97,000
423,000
161,000
262,000
56,300
30,000
26,300
195,000
70,000
125,000
166,000
61,000
105,000
417,300
161,000
256,300
60,000
31,000
29,000
200,000
70,000
130,000
183,000
73,000
110,000
443,000
174,000
269,000
347.00
297.00
342.00
323.00
383.00
237.00
346.00
302.00
375.00
289.00
374.00
334.00
395.00
373.00
368.00
374.00
281.00
351.00
322.00
329.00
134,000
36,000
246,000
416,000
359,000
57,000
152,000
40,000
196,000
388,000
338,000
50,000
147,000
42,000
239,000
428,000
375,500
52,500
175,000
48,000
211,000
434,000
375,000
59,000
160,000
55,000
257,000
472,000
415,000
57,000
329.00
846.00
345.00
383.00
431.00
589.00
521.00
493.00
458.00
586.00
491.00
489.00
498.00
689.00
520.00
530.00
422.00
422.00
403.00
412.00
Bartlett pears
Utilized production
Oregon: All
Fresh
Processed
California: All
Fresh
Processed
Washington: All
Fresh
Processed
Pacific Coast: All
Fresh
Processed
Farm price
Oregon
California
Washington
Pacific Coast
Tons
Tons
Tons
Tons
Tons
Tons
Tons
Tons
Tons
Tons
Tons
Tons
Dollars/ton
Dollars/ton
Dollars/ton
Dollars/ton
Other pears1/
Utilized production
Oregon: All
California: All
Washington: All
Pacific Coast: All
Fresh
Processed
Farm price
Oregon
California
Washington
Pacific Coast
Tons
Tons
Tons
Tons
Tons
Tons
Dollars/ton
Dollars/ton
Dollars/ton
Dollars/ton
*Shaded areas of map represent the major areas of production for this commodity. 1/ Other pears include Winter pears and Asian pears.
Source: USDA/NASS (National Agricultural Statistics Service)
Electronic access to this publication is available at: http://oain.oregonstate.edu/. Click the Commodity Data Sheets button.
OSU Extension Economic Information Estimates
Pears: Total production and value of sales, by type and district, Oregon, 2007-2009
County & type
Total production
2007r
2008r
2009p
2007r
Value of sales1/
2008r
2009p
1,000 dollars
1,000 dollars
1,000 dollars
Tons
Tons
Tons
2,257
2,218
2,239
1,292
1,271
1,280
South Western
12,054
10,927
9,427
2,529
2,195
1,979
North Central
45,820
47,020
46,090
17,138
18,636
16,097
60,131
60,165
57,756
20,958
22,102
19,357
Willamette Valley
494
462
471
751
688
725
South Western
308
289
270
435
422
374
North Central
616
616
616
370
370
370
1,418
1,367
1,357
1,556
1,480
1,469
352
344
348
155
153
155
55,190
55,146
57,274
29,055
26,180
24,331
North Central
118,600
113,820
118,350
53,822
55,913
52,718
South Central
15
20
20
10
13
12
174,157
169,330
175,992
83,041
82,259
77,216
Bartlett pears
Willamette Valley
State total
Asian pears
State total
Winter pears
Willamette Valley
South Western
State total
r - revised, p - preliminary. 1/ Totals may not add due to rounding. The Extension Economic Information Office uses different methods
than USDA/NASS to set these estimates.
Source: Oregon Agricultural Information Network (OAIN), Extension Economic Information Office, Oregon State University
Oregon State University Extension Service offers educational programs, activities, and materials-without regard to race, color, religion, sex, sexual orientation, national origin, age, marital status,
disability, and disabled veteran or Vietnam-era veteran status --as required by Title VI of the Civil
Rights Act of 1964, Title IX of the Education Amendments of 1972, and Section 504 of the Rehabilitation Act of 1973. Oregon State University Extension Service is an Equal Opportunity Employer.


