CSU, Northridge Student Population of Fall, 1995 5 Chapter 1
advertisement
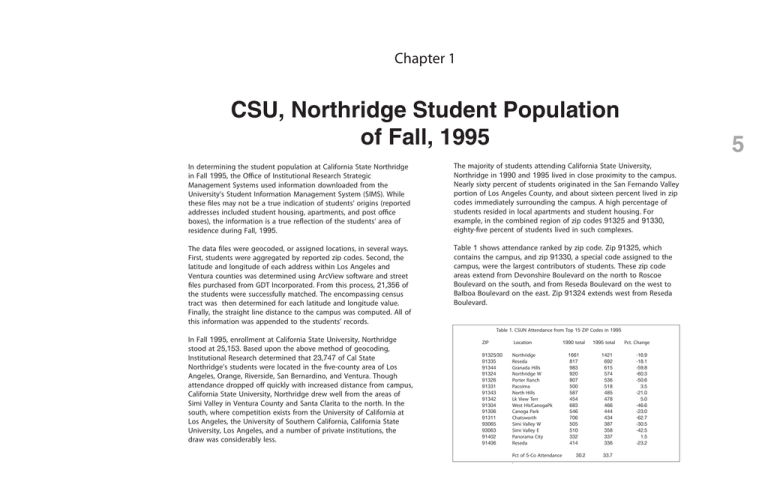
Chapter 1 CSU, Northridge Student Population of Fall, 1995 5 In determining the student population at California State Northridge in Fall 1995, the Office of Institutional Research Strategic Management Systems used information downloaded from the University’s Student Information Management System (SIMS). While these files may not be a true indication of students’ origins (reported addresses included student housing, apartments, and post office boxes), the information is a true reflection of the students’ area of residence during Fall, 1995. The majority of students attending California State University, Northridge in 1990 and 1995 lived in close proximity to the campus. Nearly sixty percent of students originated in the San Fernando Valley portion of Los Angeles County, and about sixteen percent lived in zip codes immediately surrounding the campus. A high percentage of students resided in local apartments and student housing. For example, in the combined region of zip codes 91325 and 91330, eighty-five percent of students lived in such complexes. The data files were geocoded, or assigned locations, in several ways. First, students were aggregated by reported zip codes. Second, the latitude and longitude of each address within Los Angeles and Ventura counties was determined using ArcView software and street files purchased from GDT Incorporated. From this process, 21,356 of the students were successfully matched. The encompassing census tract was then determined for each latitude and longitude value. Finally, the straight line distance to the campus was computed. All of this information was appended to the students’ records. Table 1 shows attendance ranked by zip code. Zip 91325, which contains the campus, and zip 91330, a special code assigned to the campus, were the largest contributors of students. These zip code areas extend from Devonshire Boulevard on the north to Roscoe Boulevard on the south, and from Reseda Boulevard on the west to Balboa Boulevard on the east. Zip 91324 extends west from Reseda Boulevard. Table 1. CSUN Attendance from Top 15 ZIP Codes in 1995 In Fall 1995, enrollment at California State University, Northridge stood at 25,153. Based upon the above method of geocoding, Institutional Research determined that 23,747 of Cal State Northridge’s students were located in the five-county area of Los Angeles, Orange, Riverside, San Bernardino, and Ventura. Though attendance dropped off quickly with increased distance from campus, California State University, Northridge drew well from the areas of Simi Valley in Ventura County and Santa Clarita to the north. In the south, where competition exists from the University of California at Los Angeles, the University of Southern California, California State University, Los Angeles, and a number of private institutions, the draw was considerably less. ZIP 91325/30 91335 91344 91324 91326 91331 91343 91342 91304 91306 91311 93065 93063 91402 91406 Location Northridge Reseda Granada Hills Northridge W Porter Ranch Pacoima North Hills Lk View Terr West Hls/CanogaPk Canoga Park Chatsworth Simi Valley W Simi Valley E Panorama City Reseda Pct of 5-Co Attendance . 1990 total 1661 817 983 920 807 500 587 454 683 546 706 505 510 332 414 30.2 1995 total 1421 692 615 574 536 518 485 478 466 444 434 387 358 337 336 33.7 Pct. Change -16.9 -18.1 -59.8 -60.3 -50.6 3.5 -21.0 5.0 -46.6 -23.0 -62.7 -30.5 -42.5 1.5 -23.2 Figure 1 on the left shows the distribution of students for areas outside of CSU, Northridge's service area. Similar to the attendance around the campus, enrollment is higher for the nearby counties of San Diego, Santa Barbara and Kern and less for the more distant counties to the north. Figure 1 San Mateo San Luis Obispo Sacramento Other Southern CA Counties Contra Costa Kern Santa Clara Alameda Santa Barbara San Diego Other Northern CA Counties Other ZIP Codes in 5-County Area PA NV IL HI GA NY CO AZ MD WA MA All Other States 0 20 40 60 80 100 0 10 20 120 CSUN Students Attendance from other states was also generally low, with Massachusetts sending the most students. Note: Due to the fact that some students registered their local address, rather than their originating address, out-of-state, or foreign reported totals may be lower than actual. The average distance to California State University, Northridge was computed using the matched-addresses in Los Angeles and Ventura counties. Each bar in Figure 2 represents the number of students that lived within one-mile rings surrounding the campus. The first large dip in the bars can be attributed to the presence of mountains at the edge of the San Fernando Valley. In 1990-95, the nearest Ventura County students lived 7.5 miles from the campus. 40 CSUN Students Figure 2 Change in Student Enrollment with Distance California State University, Northridge Fall, 1995 Since each incremental ring encompasses more area, the density of students was also computed, and is represented by the heavy black line. Its sharp drop attests to the rapid drop-off in attendance given increased distance/travel time. Average Distance Travelled 1400 250 Table 2 gives a breakdown of the average distance to the campus for various student and staff categories. 200 1000 800 150 600 100 400 50 200 0 0 1 2 3 4 5 6 7 8 9 10 11 12 13 14 15 16 17 18 19 20 21 22 23 24 25 30 35 40 45 50 Distance in Miles from CSU, Northridge Students Per Square Mile 1200 No. of Students 6 Attendance from Other States State County Attendance from Other California Counties Table 2 Average Distances to CSU, Northridge Group Count LA Co.Students 19083 Ventura Co. Students 2273 All Students 21356 Avg Dist 10.91 26.94 12.61 All LA Co. Staff All Ventura Co. Staff All Staff 2247 273 2520 9.08 20.10 10.27 All Non Faculty All Faculty Coaches Chairs Full-time Lecturers Librarians Part-time Faculty Tenure-track Faculty 1532 987 18 26 15 22 284 594 9.69 11.18 9.85 9.65 13.79 8.62 12.58 10.64 14 5 Lancaster Quartz Hill Palmdale Victorville 14 Ojai Fillmore 33 San Buenaventura Av era ge 101 126 5 San Fernando 23 101 Oxnard fro stance m CSU, t Di No n e rth Santa Clarita ud Valencia ri St Moorpark CSU Northridge Ventura Campus Camarillo Acton e dg Santa Paula Simi Valley 118 Thousand Oaks CSUN 210 15 Big Bear Lake Burbank 405 Glendale Pasadena 101 Westlake Village Beverly Hills Alhambra 405 1 10 110 Bell Gardena Number of Students Attending California State University, Northridge Fall, 1995 By ZIP Code California State University, Northridge Service Area Research Project Torrance Pomona Whittier La Habra La Mirada Compton 710 91 405 57 10 NORTHRIDGE © 1996 California State University Northridge Redlands 10 91 91 91 Yucaipa 60 91 Brea Banning Moreno Valley 215 Corona Anaheim Orange Perris Garden Grove Idyllwild Long Beach Huntington Beach Number of Students 100 Santa Ana Hemet 55 Tustin Costa Mesa Sun City 405 El Toro Irvine 36 square miles Newport Beach 500 1 Laguna Hills Aliso Viejo Murrieta Laguna Beach 6 miles 1500 215 Lake Elsinore Mission Viejo Laguna Niguel 15 San Juan Capistrano San Clemente CALIFORNIA STATE UNIVERSITY 91 Riverside Chino Hills Yorba Linda Cypress Colton 15 Chino Diamond Bar Fullerton 5 Ontario 60 15 map produced by Data: California State University, Northridge Office of Institutional Research. 605 Downey Fontana Claremont Covina El Monte Walnut Inglewood Five-County Area San Bernardino Monrovia 210 Monterey Park Santa Monica Professor Eugene Turner Department of Geography 7 Apple Valley Littlerock 5 Temecula The map at left provides a detailed view of student distribution in the defined service area. A heavy gray line delineates the smaller service regions within the larger area. 138 8 Figure 3 shows the distribution of students within the various service regions. The San Fernando Valley Region accounted for over fifty-seven percent of all students (address matched) attending the campus in 1995. Lancaster 14 5 Palmdale Figure 3 Number of Students from SARP Regions 14 126 Fillmore 12,000 Santa Paula 210 CSUN Thousand Oaks Glendale Westwood 10 Santa Monica Service Area Number of Students Attending CSU, Northridge, Fall, 1995 5 Downtown 1 10 50 100 400 Data: California State University, Northridge Office of Institutional Research. Inglewood 36 square miles California State University, Northridge Service Area Research Project map produced by CALIFORNIA STATE UNIVERSITY NORTHRIDGE © 1996 California State University Northridge Professor Eugene Turner Department of Geography 6,000 Number of Persons Enrolled Hollywood 405 Pasadena 4,000 2,000 6 miles Re g i o n San Fernando V. Woodland Hills 0 Number Van Nuys 3541 101 8,000 Burbank 1 10,000 South 101 Simi Valley 118 2614 Camarillo Oxnard 23 San Fernando 1335 118 Granada Hills North County Moorpark Ventura/Malibu Ventura 459 126 W. San Gabriel 33 1135 101 Valencia Other 14,000 12,271 Ojai Number of CSU, Northridge Students in Apartments Fall, 1995 Students 9 5 - 10 11 - 20 It is important to note that when the map at right was produced, many of the large apartment complexes near the campus on Lassen and Reseda were still closed or undergoing repairs from the January, 1994 earthquake. Student housing, however, was still in operation (as indicated by the large squares along Zelzah Avenue). 21 - 100 101 - 176 Data are for addresses with five or more students. Lassen St. Plummer St. Zelzah Ave. Nordhoff St. Lindley Ave. Reseda Blvd. CSU Northridge Parthenia St. Balboa Blvd. While groups of students lived in apartments throughout the service area, most were concentrated within the San Fernando Valley region. The greatest concentration of students in a single apartment complex was found within a half-mile of the campus. Only one apartment complex (with a residency of ten students) near Ventura and Lindley, exceeded the occupancy cutoff of four students. 405 5 101 2 West Hollywood 10 110 Westwood Downtown 10 10 Santa Monica Culver City Southern Service Region Number of Students Attending CSU, Northridge, Fall, 1995 California State University, Northridge Service Area Research Project 90 Marina Del Rey map produced by Professor Eugene Turner Department of Geography Number of Persons Enrolled LAX 10 50 100 CALIFORNIA STATE UNIVERSITY NORTHRIDGE © 1996 California State University Northridge Data: California State University, Northridge Office of Institutional Research. 405 110 105 4 square miles 2 miles Census Tract Populations 100 4 square miles 50 Sylmar 5 10 2 miles Data: CSU, Northridge Office of Institutional Research San Fernando Porter Ranch 118 Granada Hills Pacoima 11 210 Sunland Northridge Chatsworth CSUN Panorama City La Crescenta 405 Canoga Park Van Nuys Reseda 101 Hidden Hills 101 170 Burbank North Hollywood Tarzana 134 Woodland Hills Encino Studio City Sherman Oaks 101 San Fernando Valley Service Region Number of Students Attending CSU, Northridge, Fall, 1995 California State University, Northridge Service Area Research Project map produced by NORTHRIDGE © 1996 California State University Northridge Professor Eugene Turner Department of Geography Glendale Griffith Park 405 CALIFORNIA STATE UNIVERSITY 2 5 210 33 36 square miles Ojai 12 150 150 33 101 126 Piru Fillmore 6 miles Santa Paula 23 126 Ventura Moorpark 118 34 Camarillo 34 Oxnard Ventura County Malibu Service Region Number of Students Attending CSU, Northridge, Fall, 1995 California State University, Northridge Service Area Research Project Data: California State University, Northridge Office of Institutional Research. CALIFORNIA STATE UNIVERSITY NORTHRIDGE © 1996 California State University Northridge 101 Thousand Oaks 101 1 Number of Persons Enrolled 10 50 map produced by Professor Eugene Turner Department of Geography Simi Valley 100 118 N9 27 N1 1 Malibu 14 138 Lancaster 13 5 Palmdale 36 square miles Pearblossom Santa Clarita 6 miles Number of Persons Enrolled 126 10 14 138 Acton West San Gabriel Valley Service Region Valencia Number of Students Attending CSU, Northridge Fall, 1995 50 Number of Persons Enrolled 100 10 Data: California State University, Northridge Office of Institutional Research. 50 Altadena 210 Sierra Madre 100 134 North Los Angeles County Service Region Number of Students Attending CSU, Northridge, Fall, 1995 California State University, Northridge Service Area Research Project map produced by Professor Eugene Turner Department of Geography CALIFORNIA STATE UNIVERSITY NORTHRIDGE © 1996 California State University Northridge 210 Pasadena Arcadia San Marino 2 Mt. Washington 110 S. Pasadena Data: California State University, Northridge Office of Institutional Research. 4 square miles 14 5 ” The map at left displays student enrollment for Fall, 1990. Total enrollment for this term was recorded at 30,131. In 1995, enrollment had dropped to 25,153. Lancaster Quartz Hill Palmdale Victorville 14 Apple Valley Littlerock 14 Acton Ojai Santa Clarita Fillmore 101 Valencia Santa Paula 33 San Buenaventura 5 126 San Fernando Moorpark CSU Northridge Ventura Campus 23 101 Camarillo Oxnard 118 Simi Valley Thousand Oaks CSUN 210 15 Big Bear Lake Burbank 405 Glendale Westlake Village Beverly Hills Alhambra 405 1 10 Bell 605 California State University, Northridge Service Area Research Project Torrance La Mirada 710 91 405 Data: California State University, Northridge Office of Institutional Research. 57 Diamond Bar 60 CALIFORNIA STATE UNIVERSITY NORTHRIDGE Redlands Riverside 91 Brea 91 91 91 60 Moreno Valley 215 Corona Anaheim Orange Perris Garden Grove Long Beach Huntington Beach Number of Students 100 Santa Ana 55 Tustin Costa Mesa Sun City 405 El Toro Irvine 36 square miles Newport Beach 500 1 Laguna Hills Aliso Viejo Murrieta Laguna Beach 6 miles 1500 215 Lake Elsinore Mission Viejo Laguna Niguel 15 San Juan Capistrano San Clemente © 1996 California State University Northridge 10 91 Chino Yorba Linda Cypress Colton 15 Chino Hills Fullerton 5 Ontario 15 map produced by Professor Eugene Turner Department of Geography Whittier La Habra Compton Gardena Number of Students Attending California State University, Northridge Fall, 1990 By ZIP Code Pomona Downey Inglewood 10 Covina El Monte Walnut 110 Fontana Claremont Monterey Park Santa Monica Five-County Area San Bernardino Monrovia 210 Pasadena 101 5 Yucaipa The map at right shows the » change in enrollment between 1990 and 1995. Within the Banning five-county area, enrollment dropped from 29,723 in 1990 to 23,747 in 1995. The 20.1 percent decrease was spread over the entire service area, though more significant Idyllwild declines occurred in areas of Hemet high student populations. Increases occurred in a few areas. A large increase near the campus can be attributed to the opening of student housing after 1990. Adjustments in zip code Temecula boundaries may account for some changes within the five-year period. 14 5 Lancaster Quartz Hill Palmdale Victorville 15 Apple Valley Littlerock 14 Acton Ojai Santa Clarita Fillmore 101 Valencia Santa Paula 33 San Buenaventura 5 126 San Fernando Moorpark CSU Northridge Ventura Campus 23 101 Camarillo Oxnard 118 Simi Valley Thousand Oaks CSUN 210 15 Big Bear Lake Burbank 405 Glendale Westlake Village Beverly Hills Alhambra San Bernardino Monrovia 210 Pasadena 101 El Monte 405 1 Walnut Santa Monica 110 Bell 605 La Habra La Mirada Compton Gardena Change in Enrollment California State University, Northridge Fall, 1990 to Fall, 1995 By ZIP Code California State University, Northridge Service Area Research Project Torrance 710 91 405 Data: California State University, Northridge Office of Institutional Research. 10 57 Diamond Bar NORTHRIDGE © 1996 California State University Northridge Redlands Riverside 91 91 91 10 Yucaipa 60 91 Brea Banning Moreno Valley 215 Corona Anaheim Orange Perris Garden Grove Long Beach Huntington Beach Number of Students Gain Santa Ana Costa Mesa Sun City 405 El Toro Irvine Loss 100 Hemet 55 Tustin 36 square miles Newport Beach 250 1 Laguna Hills Aliso Viejo Murrieta Laguna Beach 6 miles 500 215 Lake Elsinore Mission Viejo Laguna Niguel 15 San Juan Capistrano San Clemente CALIFORNIA STATE UNIVERSITY 91 Chino Yorba Linda Cypress Colton 15 Chino Hills Fullerton 5 Ontario 60 15 map produced by Professor Eugene Turner Department of Geography Whittier Downey Inglewood Five-County Area Pomona Monterey Park 10 Fontana Claremont Covina 5 Temecula 138 16 Lancaster 14 5 Palmdale 14 Ojai 126 Fillmore 101 Valencia Santa Paula 33 126 Ventura 118 Camarillo Oxnard Moorpark 101 23 Simi Valley 118 Granada Hills San Fernando 210 CSUN Thousand Oaks Burbank 101 Van Nuys Glendale Woodland Hills Hollywood 405 1 1 Westwood Downtown 10 Santa Monica Service Area Number of Persons Attending College, 1990 California State University, Northridge Service Area Research Project 5 Pasadena Number of Persons Enrolled in College 100 1000 4000 8000 Data: United States 1990 Census Summary Tape File 3. Inglewood 36 square miles map produced by Professor Eugene Turner Department of Geography CALIFORNIA STATE UNIVERSITY NORTHRIDGE © 1996 California State University Northridge 6 miles
