ix TABLE OF CONTENTS
advertisement
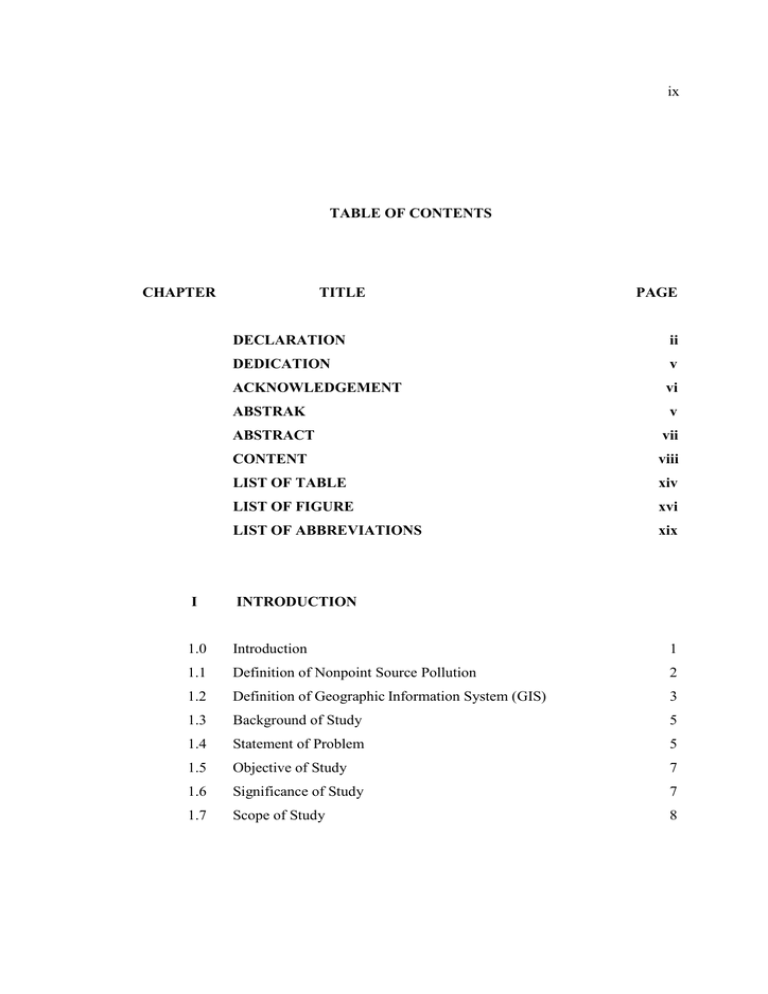
ix TABLE OF CONTENTS CHAPTER TITLE PAGE DECLARATION ii DEDICATION v ACKNOWLEDGEMENT vi ABSTRAK v ABSTRACT vii CONTENT viii LIST OF TABLE xiv LIST OF FIGURE xvi LIST OF ABBREVIATIONS xix I INTRODUCTION 1.0 Introduction 1 1.1 Definition of Nonpoint Source Pollution 2 1.2 Definition of Geographic Information System (GIS) 3 1.3 Background of Study 5 1.4 Statement of Problem 5 1.5 Objective of Study 7 1.6 Significance of Study 7 1.7 Scope of Study 8 x 1.7.1 Site Description 9 1.7.2 Catchment Area 11 1.7.3 Frequency and Parameter of Sampling 12 II LITERATURE REVIEW 2.0 Introduction 13 2.1 Project Description 14 2.2 River 15 2.3 Water Quality 16 2.3.1 Physical Parameter 18 2.3.1.1 Suspended Solid 19 2.3.1.2 Turbidity 19 2.3.1.3Temperature 20 2.3.1.4 Odor 21 Chemical Parameter 22 2.3.2.1 Biological Oxygen Demand 22 2.3.2.2 Chemical Oxygen Demand 21 2.3.2.3Dissolved Oxygen 23 2.3.2.4 Ammoniac Nitrogen 24 2.3.2.5 pH 24 2.3.2 2.4 Water Quality Assessment: Water Quality Index (WQI) 27 2.5 Water Pollution and Sources 29 2.5.1 29 Sources of Water Pollution 2.5.1.1 Point Source 29 2.5.1.2 Non-point Source 30 2.6 Assessment for Water Quality 31 2.7 Water Quality Monitoring 32 2.8 Geographic Information System (GIS) 34 xi 2.8.1 2.9 ArcGIS 9.1 36 2.8.1.1 ArcMap 36 2.8.1.2 ArcGIS 3D Analyst 37 Nonpoint Source Pollution Models 39 2.9.1 Agriculture Nonpoint Source (AGNPS) 40 2.9.2 Areal Nonpoint Source Watershed Environment Response Simulation (ANSWERS) 41 2.9.3 Storm Water Management Model (SWMM) 41 2.9.4 Universal Soil Loss Equation (USLE) 42 GIS-Based Nonpoint sources Pollution Model 43 2.10.1 Expected Mean Concentration 44 2.10.2 Rainfall-Runoff Analysis 46 2.11 Related Works 47 2.12 Previous Study 49 2.13 Summary 50 2.10 III METHODOLOGY 3.1 Introduction 52 3.2 Identification of Study Area 53 3.3 Data Acquisition 54 3.4 3.5 3.3.1 Primary data 54 3.3.2 Secondary Data 55 Laboratory Work 55 3.4.1 Biochemical Oxygen Demand (BOD) 55 3.4.2 Chemical oxygen demand (COD) 58 3.4.3 Total Suspended Solid Test 59 3.4.4 Ammonical nitrogen 61 3.4.5 Oil and grease (O&G) 62 GIS Integration 64 xii 3.5 3.5.1 Nonpoint Source Pollution Modeling Description 66 3.5.2 Establishing a River Basin GIS Database 67 3.5.3 Generation of DTM 71 3.5.4 Rainfall-runoff analysis 73 3.5.5 Expected Mean Concentration Values 74 3.5.6 Pollutant Loading Assessment 77 3.5.7 Accumulative Pollutant Loading Assessment 78 3.5.7.1 Flow Direction 78 3.5.7.2 Flow Accumulation 78 Summary 79 IV RESULT AND ANALYSIS 4.1 Introduction 81 4.2 Water Quality Index (WQI) 81 4.3 GIS Modeling result and analysis 85 4.3.1 Digital Elevation Model 85 4.3.2 Rainfall-Runoff Analysis 86 4.3.3 Expected Mean Concentration value (EMC) 88 4.3.4 Accumulative Pollutant Loading Assessment 88 4.3.4.1 Flow Direction 89 4.3.4.2 Flow Accumulation 90 4.4 Assessment Approach 90 4.5 Results Assessment 94 4.5.1 Biochemical Oxygen Demand (BOD) 94 4.5.2 Total Suspended Solid (TSS) 97 4.5.3 Ammonical Nitrogen (NH3-N) 98 4.6 Corrective Measure 100 4.7 Summary 102 xiii V CONCLUSION AND RECOMMENDATION 5.1 Introduction 103 5.2 Major Finding 103 5.3 Future Research 105 REFERENCES 106 Appendices A-D 111 xiv LIST OF TABLE TABLE NO. TITLE PAGE 1.1 Land Use Area of the Project Site 9 1.2 The Area of Coverage for the Water Catchment 11 2.0 Physical and Chemical Parameters 19 2.1 Water Quality Index (WQI) Criteria 27 2.2 DOE Water Quality Index Classes 29 2.3 The Possible Land-Water Transform Coefficients 44 3.0 Measurable BOD using Various Dilutions of Samples. 56 3.1 Monthly Average of Generated Discharge for 2009 73 3.2 Land Use Description and Codes 76 3.3 EMC Values of Pollutants Based on Land Use. 75 4.2 (a) Water Quality Index for First Sampling, 13 February 2009 81 4.2 (b) Water Quality Index for Second Sampling 21 April 2009 82 4.2 (c) Water Quality Index for Third Sampling 1 September l 2009 83 xv 4.3 Annual Runoff 87 4.4 Expected Mean Concentration Table for Study Area. 88 4.5 Pollutant Load Calculation 92 4.6 The Annual Accumulative Pollutant Load (kg/year) 94 xvi LIST OF FIGURE FIGURE NO. TITLE PAGE 1.0 Oil Palm Plantation and Reserved Forest the Proposed Road 10 1.1 Sampling Points 10 1.2 The Catchment of the Study Area 12 2.1 Status of River Basin Water Quality 2005 18 2.2 Network for Water Quality Monitoring 34 2.3 Perform Modeling and Analysis Using ArcGIS 38 2.4 The 3D Extension for ArcGIS Server 39 2.5 Hydrograph, Pollutograph and Loadgraph 46 2.6 Comparison of Pollutographs and EMC for Storm Events 46 3.1 Methodology Flow Chart 53 3.2 Apparatus Used to Measure Dissolved Oxygen in BOD Test. 58 3.3 Apparatus Used to Measure COD 59 3.4 Apparatus Used to Measure TSS 61 xvii 3.5 Apparatus for Oil and Grease Test 64 3.6 The GIS Integration Overview 65 3.7 The Nonpoint Source Pollutant Modeling 67 3.8 The Digitized River Network 69 3.9 Construction of the Runoff Grid, Expected Mean Concentration (EMC) Grid and Assessment of Pollutant Loading 70 3.10 Contour Line Digitizing Using ArcGIS 72 3.11 Chart for Discharge Value for Each Station 74 3.12 Joining of Table land use and EMC 76 4.0 Elevation Surface of Study Area 85 4.1 Stream network overlaid with elevation surface 86 4.2 The Yearly Runoff Grid 87 4.3 The Flow Analysis using GIS 89 4.4 Flow Direction Grid of the study area 89 4.5 Flow Accumulation Grid of the study area 90 4.6 Pollutant Accumulated Loading Map 91 4.7 (a) Annual Accumulative Pollutant Load for BOD and NH3N 93 4.7 (b) Annual Accumulative Pollutant Load for TSS 93 4.8 Differences in BOD Loading 95 xviii 4.9 Daily Rainfall for the Study Area 95 4.10 BOD Pollutant Laoding for W4 96 4.11 Differences in TSS Loading 97 4.12 BOD Pollutant Laoding During Construction Stage 98 4.13 NH3N Loading for Each Sampling Station 99 xix LIST OF ABBREVIATIONS µg - micro gram AN - Ammoniacal-nitrogen BMP BOD Best Management Practice - Biochemical Oxygen Demand C Runoff Coefficient CAD Computer-aided Design COD - Chemical Oxygen Demand CN Curve Number DEM Digital Elevation Model DFX AutoCAD Exchange Format DO - Dissolved Oxygen DOE - Department of Environment EMC Expected Mean Concentration ESRI Environmental System Research Institute g - gram GIS - Geographic Coordinate System GPS - Global Positioning System GRASS ha Geographical Analysis Support System - Hectares IDW Inverse Distance Weighted JKR Jabatan Kerja Raya JUPEM - Jabatan Ukur dan Pemetaan Malaysia m - meter xx mg - NPS milligram Non-Point Source ppm - part per million RSO - Rectified Skew Orthomorphic TIN USGS Triangulated Irrigular Network - United State Geological Survey USLE Universal Soil Loss Equation UV Ultraviolet WQI 3D - Water Quality Index Three Dimension xxi LIST OF APPENDIX APPENDICES TITLE PAGE A Excel Sheet of WQI Calculation 103 B The Modeler for the NPS Modeling 104 C1 Johor Land Use Map 105 C2 Rainfall Data 106 D1 Tables of Attributes 107 D2 Metadata of GIS Output Grid (FDGC ESRI Xml) 108
