vii ii iii
advertisement
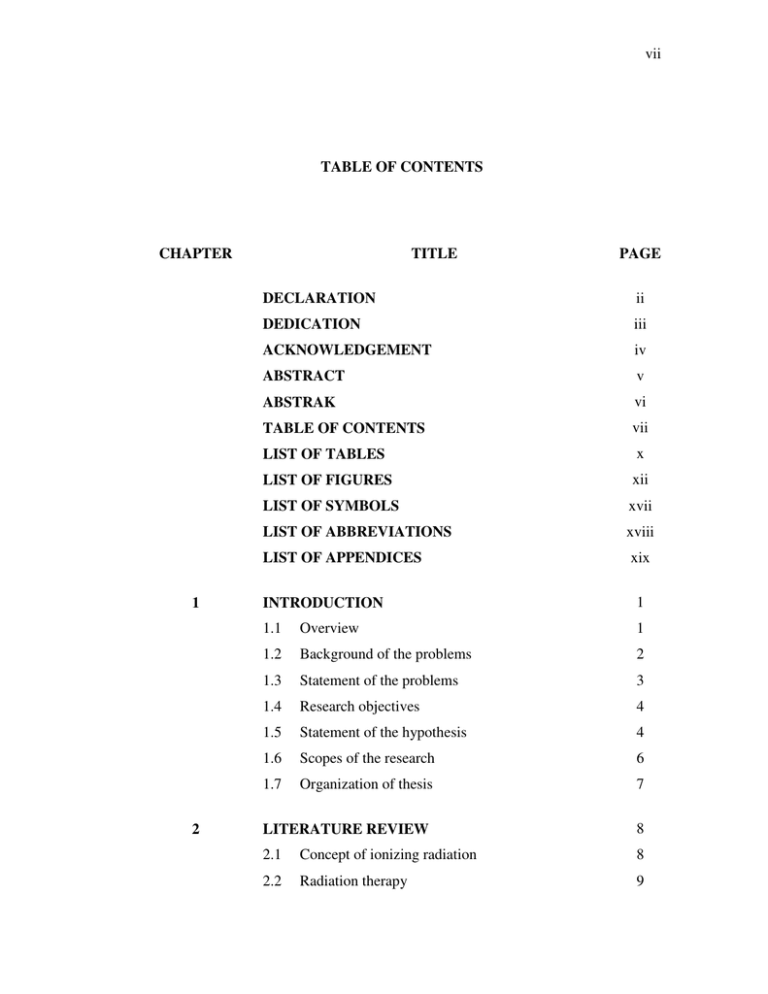
vii TABLE OF CONTENTS CHAPTER 1 2 TITLE PAGE DECLARATION ii DEDICATION iii ACKNOWLEDGEMENT iv ABSTRACT v ABSTRAK vi TABLE OF CONTENTS vii LIST OF TABLES x LIST OF FIGURES xii LIST OF SYMBOLS xvii LIST OF ABBREVIATIONS xviii LIST OF APPENDICES xix INTRODUCTION 1 1.1 Overview 1 1.2 Background of the problems 2 1.3 Statement of the problems 3 1.4 Research objectives 4 1.5 Statement of the hypothesis 4 1.6 Scopes of the research 6 1.7 Organization of thesis 7 LITERATURE REVIEW 8 2.1 Concept of ionizing radiation 8 2.2 Radiation therapy 9 viii 2.3 Introduction of Scanning Electron Microscopy 10 (SEM) 2.3.1 Resolution 10 2.3.2 Interaction of electron with matter 10 2.4 Theoretical models of thermoluminescence 12 2.5 Thermoluminescence mechanism 13 2.6 Thermoluminescence studies on optical fibres 14 2.7 TLD Characteristics 17 2.7.1 A relatively simple glow curve 17 2.7.2 High sensitivity 17 2.7.3 Simple annealing techniques 18 2.7.4 Linearity of dose response 19 2.7.5 Low fading 20 2.7.6 Negligible dependence of radiation 21 energy 3 4 2.7.7 Minimum detectable dose (MDD) 21 2.7.8 The effective atomic number, Zeff 22 2.8 Optical fibres fabrication 23 2.9 Scanning electron microscopy (SEM) 23 METHODOLOGY 25 3.1 TL materials 25 3.2 Sample preparations 27 3.3 Annealing 28 3.4 Encapsulation 30 3.5 Irradiation 31 3.6 TL measurement 33 3.7 Scanning Electron Microscopy (SEM) 34 TL MEASUREMENTS 38 4.1 38 Overview ix 5 4.2 Glow curve analysis 39 4.3 Dose response and linearity 47 4.4 Sensitivity 69 4.5 Energy response 74 4.6 Fading 79 4.7 Reproducibility 87 4.8 Minimum detectable dose (MDD) 94 4.9 The effective atomic number, Zeff 95 CONCLUSION 97 5.1 Summary of Findings 97 5.2 Recommendations and Future Research 100 REFERENCES 101 Appendices A 106 x LIST OF TABLES TABLE NO. 3.1 TITLE PAGE List of the optical fibres been irradiated for first, second and 26 third irradiation. 3.2 Irradiation set up at UMMC for second and third irradiation. 32 4.1 Summary of main peak value for each TLD. 46 4.2 Sensitivity and relative sensitivity of each optical fibre 70 compared to standard dosimeter, TLD-100 rods irradiate at Pantai Hospital (1st irradiation). 4.3 Sensitivity and relative sensitivity of each optical fibre 71 compared to standard dosimeter, TLD-100 rods irradiate at UMMC (2nd irradiation). 4.4 Sensitivity and relative sensitivity of each optical fibre 73 compared to standard dosimeter, TLD-100 rods irradiate at UMMC (3rd irradiation). 4.5 Fading response for 14 days after irradiation at 1 Gy. 85 4.6 Percentage of signal loss after irradiation at 1 Gy. 86 4.7 TL response of Ge (A) for 1st and 2nd irradiation. 88 4.8 TL measurements of Ge (B) for first and second 89 irradiations. 4.9 TL measurements of Er for first and second irradiations. 90 4.10 TL measurements of PCF for first and second irradiations. 91 4.11 TL measurements of MPCF 2 mm for first and second 92 irradiations. xi 4.12 TL measurements of MPCF 220 µm for first and second 93 irradiations. 4.13 Minimum detectable dose for all optical fibres. 94 xii LIST OF FIGURES FIGURE NO. TITLE PAGE 2.1 Production of electron-matter interactions. 11 2.2 TL mechanism process. 14 3.1 The optical fibres before cut. 27 3.2 The optical fibres after cut into 0.5 cm. 27 3.3 An optical fibre cleaver (Fujikura, Japan) was used to cut the 27 fibres. 3.4 BSA224S-CW analytical balance (Sartorius, Germany). 28 3.5 A furnace (Harshaws) used to anneal TL materials. 29 3.6 TLD-100 rods were placed on a stainless steel plate for 29 annealing procedure. 3.7 The fibres were placed inside vegetable-based gelatine 30 capsule. 3.8 Dymax 5-06260160 (Surrey, England) electrical vacuum. 30 3.9 Linear Accelerator Elekta Synergy of electron irradiation at 31 Pantai Hospital radiotherapy unit. 3.10 Varian Model 2100C linear accelerator for electron 33 irradiation at UMMC radiotherapy unit. 3.11 Harshaw 3500 TL reader was used to take the TL reading. 34 3.12 The optical fibres were put on the sample stage. 35 3.13 Scanning Electron Microscopy with Gemini® Column. 35 ® 3.14 Operating principle of the GEMINI field emission column. 36 4.1 Glow curve of TLD-100 at 1 Gy irradiate at UMMC at 6 39 xiii MeV of electron irradiation. 4.2 Glow curve of PFF at 1 Gy irradiated with 6 MeV of 40 electrons. 4.3 Glow curve of FF at 1 Gy irradiated with 6 MeV of 41 electrons. 4.4 Glow curve of Ge (A) 1st batch at 1 Gy irradiated with 6 41 MeV of electrons. 4.5 Glow curve of Ge (A) 2nd batch at 1 Gy irradiated with 6 42 MeV of electrons. 4.6 Glow curve of Ge (A) 3rd batch at 1 Gy irradiated with 6 42 MeV of electrons. 4.7 Glow curve of MPCF 2 mm at 1 Gy irradiated with 6 MeV 43 of electrons. 4.8 Glow curve of Al+Tm at 1 Gy irradiated with 6 MeV of 43 electrons. 4.9 Glow curve of DFF at 1 Gy irradiated with 6 MeV of 44 electrons. 4.10 Glow curve of Ge (B) at 1 Gy irradiated with 6 MeV of 44 electrons. 4.11 Glow curve of PCF 2nd batch at 1 Gy irradiated with 6 MeV 45 of electrons. 4.12 Glow curve of MPCF 220 µm at 1 Gy irradiated with 6 MeV 45 of electrons. 4.13 TL response of Ge (A) 1st batch compared with TLD-100 at 47 6 MeV of electron irradiation at Pantai Hospital. 4.14 TL response of Ge (B), Er and PCF at 6 MeV of electron 48 irradiation at Pantai Hospital. 4.15 f (D) of Ge (A) at 6 MeV of electrons at Pantai Hospital. 49 4.16 f (D) of Ge (B) at 6 MeV of electrons at Pantai Hospital. 50 4.17 f (D) of Er at 6 MeV of electrons at Pantai Hospital. 50 4.18 f (D) of PCF at 6 MeV of electrons at Pantai Hospital. 51 xiv 4.19 TL response of Ge (A) 2nd batch and MPCF 2 mm at 6 MeV 52 of electrons at UMMC (2nd irradiation). 4.20 TL response of MPCF 220 µm and PCF 2nd batch at 6 MeV 52 of electrons at UMMC (2nd irradiation). 4.21 f (D) of Ge (A) 2nd batch at 6 MeV of electrons at UMMC. 53 4.22 f (D) of MPCF 2 mm at 6 MeV of electrons at UMMC. 54 4.23 f (D) of MPCF 220 µm at 6 MeV of electrons at UMMC. 54 4.24 f (D) of PCF 2nd batch at 6 MeV of electrons at UMMC. 55 4.25 TL response of PFF, FF and DFF at 6 MeV of electrons at 56 UMMC (3rd irradiation). 4.26 TL response of Ge (A) for all batches at 6 MeV of electrons 57 rd at UMMC (3 irradiation). 4.27 Average TL response of Ge (A) for all batches at 6 MeV of 57 electrons at UMMC (3rd irradiation). 4.28 TL response of MPCF 2 mm MPCF 220 µm at 6 MeV of 58 electrons at UMMC (3rd irradiation). 4.29 TL response of PCF 2nd batch and 3rd batch with their 59 average of TL response at 6 MeV of electron irradiation at UMMC (3rd irradiation). 4.30 TL response of Al+Tm, Er and Ge (B) at 6 MeV of electrons 60 at UMMC (3rd irradiation). 4.31 f (D) of PFF at 6 MeV of electrons at UMMC. 61 4.32 f (D) of FF at 6 MeV of electrons at UMMC. 62 4.33 f (D) of Ge (A) 1st batch at 6 MeV of electrons at UMMC. 62 4.34 f (D) of Ge (A) 3rd batch at 6 MeV of electrons at UMMC. 63 4.35 f (D) of Ge (A) 2nd batch at 6 MeV of electrons at UMMC. 64 4.36 f (D) of MPCF 2 mm at 6 MeV of electrons at UMMC. 64 4.37 f (D) of DFF at 6 MeV of electrons at UMMC. 65 4.38 f (D) of Al+Tm batch at 6 MeV of electrons at UMMC. 65 4.39 f (D) of Er at 6 MeV of electrons at UMMC. 66 4.40 f (D) of MPCF 220 µm at 6 MeV of electrons at UMMC. 66 xv 4.41 f (D) of Ge (B) at 6 MeV of electrons at UMMC. 67 4.42 f (D) of PCF 2nd batch at 6 MeV of electrons at UMMC. 68 4.43 f (D) of PCF 3rd batch at 6 MeV of electrons at UMMC. 68 4.44 Energy response of Al+Tm doped SiO2 at 6 MeV, 9 MeV 74 and 12 MeV of electron irradiation. 4.45 Energy response of DFF at 6 MeV, 9 MeV and 12 MeV of 75 electron irradiation. 4.46 Energy response of FF at 6 MeV, 9 MeV and 12 MeV of 75 electron irradiation. 4.47 Energy response of Ge (A) 2nd batch doped SiO2 at 6 MeV, 9 76 MeV and 12 MeV of electron irradiation. 4.48 Energy response of Ge (A) 3rd batch doped SiO2 at 6 MeV, 9 76 MeV and 12 MeV of electron irradiation. 4.49 Energy response of MPCF 220 µm doped SiO2 at 6 MeV, 9 77 MeV and 12 MeV of electron irradiation. 4.50 Energy response of MPCF 2 mm doped SiO2 at 6 MeV, 9 77 MeV and 12 MeV of electron irradiation. 4.51 Energy response of PCF 2nd batch doped SiO2 at 6 MeV, 78 9 MeV and 12 MeV of electron irradiation. 4.52 Energy response of PCF 3rd batch doped SiO2 at 6 MeV, 78 9 MeV and 12 MeV of electron irradiation. 4.53 Energy response of PFF at 6 MeV, 9 MeV and 12 MeV of 79 electron irradiation. 4.54 Fading of Er doped SiO2 for 14 days at 1 Gy. 80 4.55 Fading of Er doped SiO2 for 14 days at 1 Gy after 81 normalized at 1st day. 4.56 Fading of FF for 14 days at 1 Gy. 81 4.57 Fading of FF for 14 days at 1 Gy after normalized at 1st day. 82 4.58 Fading of Ge (A) doped SiO2 for 14 days at 1 Gy. 82 4.59 Fading of Ge (A) doped SiO2 for 14 days at 1 Gy after 83 normalized at 1st day. xvi 4.60 Fading of PCF doped SiO2 for 14 days at 1 Gy. 83 4.61 Fading of PCF doped SiO2 for 14 days at 1 Gy after 84 normalized at 1st day. 4.62 Fading of PFF for 14 days at 1 Gy. 84 4.63 Fading of PFF for 14 days at 1 Gy after normalized at 1st 85 day. 4.64 TL response of Ge (A) for 1st and 2nd exposure at 6 MeV of 88 electron irradiation. 4.65 TL response of Ge (B) for 1st and 2nd exposure at 6 MeV of 89 electron irradiation. 4.66 TL response of Er for 1st and 2nd exposure at 6 MeV of 90 electron irradiation. 4.67 TL response of PCF for 1st and 2nd exposure at 6 MeV of 91 electron irradiation. 4.68 TL response of MPCF 2 mm for 1st and 2nd exposure at 6 92 MeV of electron irradiation. 4.69 TL response of MPCF 220 µm for 1st and 2nd exposure at 6 93 MeV of electron irradiation. 4.70 Dopant concentration and Zeff for Er, Ge (A) and Ge (B) doped optical fibres. 95 xvii LIST OF SYMBOLS Eo Electron original energy Ƭ Lifetime Z Atomic number of the atom θ Small scattering angle El Electron energy of the elastic scattering SΔ The linear stopping power e The electronic charge LiF Lithium fluoride CaSO4 Calcium sulphate Bmean The mean TL background signal σ The standard deviation F TL system calibration factor Do Threshold dose N2 Nitrogen gas SiO2 Silicon dioxide MU Monitor Units Zeff The effective atomic number Sd Relative sensitivity xviii LIST OF ABBREVIATIONS TLD Thermoluminescence dosimetry ICRP International Commission of Radiological Protection TL Thermoluminescence LET Linear energy transfer MCVD Modified Chemical Vapour Deposition LINAC Linear accelerator SEM Scanning electron microscope ALARA As low as reasonable acievable PCS Plastic clad silica MU Monitor unit PDD Percentage depth dose FSD Field source distance PMT Photomultiplier xix LIST OF APPENDICES APPENDIX A TITLE Titles of Paper Presentation (International/Local) PAGE 106
