vii ii iii
advertisement
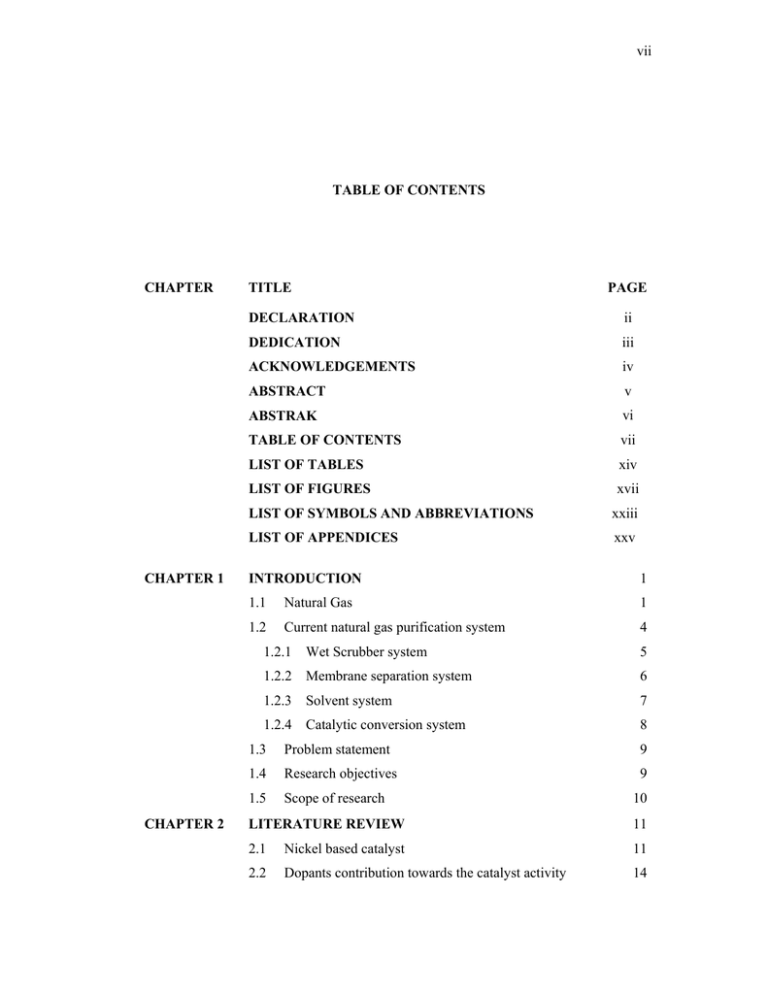
vii TABLE OF CONTENTS CHAPTER CHAPTER 1 CHAPTER 2 TITLE PAGE DECLARATION ii DEDICATION iii ACKNOWLEDGEMENTS iv ABSTRACT v ABSTRAK vi TABLE OF CONTENTS vii LIST OF TABLES xiv LIST OF FIGURES xvii LIST OF SYMBOLS AND ABBREVIATIONS xxiii LIST OF APPENDICES xxv INTRODUCTION 1 1.1 Natural Gas 1 1.2 Current natural gas purification system 4 1.2.1 Wet Scrubber system 5 1.2.2 Membrane separation system 6 1.2.3 Solvent system 7 1.2.4 Catalytic conversion system 8 1.3 Problem statement 9 1.4 Research objectives 9 1.5 Scope of research 10 LITERATURE REVIEW 11 2.1 Nickel based catalyst 11 2.2 Dopants contribution towards the catalyst activity 14 viii 2.3 Metal oxide as promoters 2.3.1 Catalysis by magnesium oxide 15 2.3.2 Catalysis by zirconium oxide 17 2.3.3 Catalysis by molybdenum oxide 19 2.3.4 Catalysis by manganese oxide 21 2.3.5 Catalysis by cobalt oxide 22 2.3.6 Catalysis by iron oxide 25 2.3.7 Catalysis by copper oxide 27 2.4 Addition of rare earth elements as dopants 2.4.1 2.5 Catalysis by praseodymium oxide Supported catalyst 2.5.1 CHAPTER 3 15 Different forms of support 29 30 31 33 2.5.1.1 Honeycomb monoliths 33 2.5.1.2 Bead catalysts 36 2.5.1.3 Molecular sieves 37 EXPERIMENTAL 40 3.1 40 Synthesis of the catalyst 3.1.1 Preparation of unsupported catalyst 40 3.1.2 Preparation of supported catalyst 42 3.2 Catalytic performance 45 3.2.1 Experimental set-up 45 3.2.2 Catalytic test 47 3.2.3 Fourier Transformed Infra Red analysis (FTIR) 48 3.3 Characterization of catalyst 49 3.3.1 X-Ray Diffraction (XRD) 50 3.3.2 X-Ray Photoelectron Spectroscopy (XPS) 51 3.3.3 Scanning Electron Microscopy (SEM) 55 and Energy Dispersive X-ray Analysis (EDX) 3.3.4 Nitrogen gas Adsorption (pore texture analysis) 56 3.3.5 Single Point BET analysis 58 3.3.6 Fourier Transform Infrared Spectroscopy 60 (FTIR) ix CHAPTER 4 CATALYTIC ACTIVITY, MEASUREMENTS AND 62 CHARACTERIZATION OF UNSUPPORTED CATALYST 4.1 Catalytic activity measurements 62 4.1.1 Addition of Mg2+ 64 4.1.2 Addition of Zr4+ 65 4.1.3 Addition of Mo6+ 66 4.1.4 Addition of Mn3+ 68 4.1.5 4.1.6 2+ 69 3+ 70 2+ Addition of Co Addition of Fe 4.1.7 Addition of Cu 72 4.1.8 Comparison of Ni/M*/Pr catalyst with the ratio 73 of 6:10:30 and 6:30:10 (M=Mg, Zr, Mo, Mn, Co, Fe, andCu) 4.1.9 Catalytic activity measurements of unsupported 74 Ni/Co/Pr catalyst in various ratios of elemental compositions 4.1.10 Comparison of unsupported Ni/Co/Pr catalyst 76 with unsupported Ni/Pr catalyst 4.1.11 Life span of the unsupported Ni/Co/Pr catalyst 4.2 Characterization 4.2.1 X-ray diffraction analysis (XRD) 4.2.1.1 XRD analysis on Ni/Mg/Pr catalyst with 76 77 78 78 different ratios 4.2.1.2 XRD analysis on Ni/Fe/Pr catalyst with 80 different ratios 4.2.1.3 XRD analysis on Ni/Co/Pr catalyst with 81 different ratios 4.2.1.4 XRD on Ni/Co/Pr(60:35:5) catalyst at 83 different calcination temperatures 4.2.2 Scanning electron microscopy analysis (SEM) 85 4.2.3 Energy Dispersive X-ray analysis(EDX) 86 4.2.4 Nitrogen gas Adsorption analysis (NA) 87 x 4.2.5 Single point BET analysis 4.2.5.1 Ni/M*/Pr with the ratio of 60:10:30 (M = 90 90 Mg, Zr, Mo, Mn, Co, Fe, and Cu) 4.2.5.2 Ni/M*/Pr with the ratio of 60:30:10 (M = 91 Mg, Zr, Mo, Mn, Co, Fe, and Cu) 4.2.5.3 Comparison of unsupported Ni/Co/Pr 93 (60:35:5) with Ni/Pr (60:40) and Ni/Co (60:40) catalyst 4.2.6 CHAPTER 5 Fourier Transformed Infra-Red analysis (FTIR) CATALYTIC ACTIVITY, MEASUREMENTS 93 96 AND CHARACTERIZATION OF SUPPORTED CATALYST 5.1 Catalytic activity measurements 5.1.1 Comparison of Ni/Co/Prcatalyst 96 97 performance on various supports 5.1.2 Comparison of cordierite supported Ni/Co/Pr 98 catalyst with various catalyst elemental ratios 5.1.3 Comparison of cordierite supported Ni/Co/Pr 99 catalyst with various catalyst loading percentages 5.1.4 Comparison of cordierite supportedNi/Co/Pr 101 catalyst with various calcination temperatures 5.1.5 Comparison of cordierite supported Ni/Co/Pr 102 catalyst with addition of washcoat 5.1.6 Comparison of Ni/Co/Pr (60:35:5) catalyst 103 with Ni/Pr (60:40) catalyst 5.1.7 Life span of cordierite supported Ni/Co/Pr 104 catalyst 5.1.8 Poisoning of cordierite supported Ni/Co/Pr 105 catalyst 5.2 Characterization 5.2.1 X-ray diffraction analysis (XRD) 106 106 xi 5.2.1.1 Ni/Co/Pr (60:35:5) catalyst supported 107 onto alumina bead 5.2.1.2 Ni/Co/Pr (60:35:5) catalyst supported 108 onto molecular sieve 5.2.1.3 Ni/Co/Pr (60:35:5) catalyst supported 109 onto cordierite 5.2.1.4 Comparison of cordierite supported Ni/ 112 Pr catalyst (60:40) before and after the catalytic test 5.2.1.5 Comparison of Ni/Co/Pr catalyst with 113 zirconium as binder before and after the catalytic test 5.2.2 X-ray Photoelectron Spectroscopy analysis 114 (XPS) on series of cordierite supported Ni/Co/Pr catalyst at different stages of catalytic tests 5.2.2.1 Surface composition of Ni (2p) in 115 cordierite supported Ni/Co/Pr catalyst at different stages of catalytic tests 5.2.2.2 Surface composition of Co (2p) in 118 cordierite supported Ni/Co/Pr catalyst at different stages of catalytic tests 5.2.2.3 Surface composition of Pr (2p) in 120 cordierite supported Ni/Co/Pr catalyst at different stages of catalytic tests 5.2.2.4 Surface composition of Mg (2p) in 120 cordierite supported Ni/Co/Pr catalyst at different stages of catalytic tests 5.2.2.5 Surface composition of Al (2p) in cordierite supported Ni/Co/Pr catalyst at different stages of catalytic tests 123 xii 5.2.2.6 Surface composition of Si (2p) in 125 cordierite supported Ni/Co/Pr catalyst at different stages of catalytic tests 5.2.2.7 Surface composition of O (1s) in 127 cordierite supported Ni/Co/Pr catalyst at different stages of catalytic tests 5.2.2.8 Catalyst composition and carbon 130 contamination in cordierite supported Ni/Co/Pr catalyst at different stages of catalytic tests 5.2.3 Scanning electron microscopy analysis 131 (SEM) 5.2.4 Energy Dispersive X-ray Analysis (EDX) 5.2.4.1 EDX of alumina bead supported 134 135 Ni/Co/Pr catalyst with the ratio of 60:35:5 5.2.4.2 EDX of molecular sieve supported 136 Ni/Co/Pr catalyst with the ratio of 60:35:5 5.2.4.3 EDX of cordierite supported Ni/Co/Pr 137 catalyst with the ratio of 60:35:5 5.2.5 Nitrogen gas Adsorption analysis (NA) 138 5.2.6 Single Point BET analysis 141 5.2.6.1 Ni/Co/Pr (60:35:5) catalyst with 141 different supports 5.2.6.2 Comparison of cordierite supported 142 Ni/Co/Pr (60:35:5) with Ni/Pr (60:40) and Ni/Co (60:40) catalyst 5.2.7 CHAPTER 6 Fourier Transformed Infra-Red analysis (FTIR) CONCLUSIONS AND SUGGESTIONS FOR FURTHER STUDY 6.1 Conclusions 143 146 146 xiii 6.2 Suggestions for further study REFERENCES 148 149 APPENDICES APPENDIX A 174 APPENDIX B 175 APPENDIX C 178 APPENDIX D 184 xiv LIST OF TABLES TABLE TITLE PAGE NO. 1.1 Chemical composition in crude natural gas in weight 4 percent 3.1 Parameters for catalytic activity measurements 47 3.2 Spectroscopic notation used in XPS 52 3.3 Classification of infrared radiation 60 4.1 Positions of the characteristic infrared stretching bands for 63 CO2, CO, CH4, and OH 4.2 Average particle size calculated from SEM for unsupported 85 Ni/Co/Pr catalyst in the ratio of 60:35:5 4.3 Elemental composition of unsupported Ni/Co/Pr catalyst 86 (60:35:5) 4.4 Nitrogen gas adsorption analysis for unsupported Ni/M*/Pr 87 catalyst in the ratio of 60:35:5. (M = Mg, Fe, Co). 4.5 Types of BET isotherms and porosity for unsupported 88 Ni/M*/Pr catalyst. (M = Mg, Fe, and Co). 4.6 Summary of type of hysteresis and shape of pores for 90 unsupported Ni/M*/Pr catalyst. (M = Mg, Fe, and Co). 4.7 Surface area of unsupported Ni, Ni/Pr (60:40), and 91 Ni/M*/Pr catalyst (60:10:30) before and after catalytic test. (M = Mg, Zr, Mo, Mn, Co, Fe, and Cu) 4.8 Surface area of unsupported Ni, Ni/Pr (60:40), and Ni/M*/Pr catalyst (60:30:10) before and after catalytic test (M = Mg, Zr, Mo, Mn, Co, Fe, and Cu) 92 xv 4.9 BET surface area of unsupported Ni/Co/Pr (60:35:5) 93 catalyst with Ni/Pr (60:40) and Ni/Co (60:40) catalyst 5.1 Parameters obtained by deconvolution of XPS spectra for 116 Ni (2p) peaks in Ni/Co/Pr catalyst material 5.2 Parameters obtained by deconvolution of XPS spectra for 118 Co (2p) peaks in Ni/Co/Pr catalyst material 5.3 Mass percentage obtained by deconvolution of XPS spectra 120 for Pr (2p) peaks in Ni/Co/Pr catalyst material 5.4 Parameters obtained by deconvolution of XPS spectra for 121 Mg (2p) peaks in Ni/Co/Pr catalyst material 5.5 Parameters obtained by deconvolution of XPS spectra for 123 Al (2p) peaks in Ni/Co/Pr catalyst material 5.6 Parameters obtained by deconvolution of XPS spectra for 125 Si (2p) peaks in Ni/Co/Pr catalyst material 5.7 Parameters obtained by deconvolution of XPS spectra for 128 O (1s) peaks in Ni/Co/Pr catalyst material 5.8 Mass percentage of the catalyst obtained by deconvolution 130 of XPS spectra in Ni/Co/Pr catalyst material 5.9 Mass percentage of carbon contamination by deconvolution 131 of XPS spectra for C (2p) peaks in Ni/Co/Pr catalyst material 5.10 Average particle size calculated from SEM for Ni/Co/Pr 134 catalyst in the ratio of 60:35:5 with various supports 5.11 Elemental composition of alumina bead supported 135 Ni/Co/Pr catalyst (60:35:5) 5.12 Elemental composition of molecular sieve supported 137 Ni/Co/Pr catalyst (60:35:5) 5.13 Elemental composition of cordierite supported Ni/Co/Pr 138 catalyst (60:35:5) 5.14 Nitrogen gas adsorption analysis for supported Ni/Co/Pr catalyst in the ratio of 60:35:5 with different supports 139 xvi 5.15 Types of BET isotherms and porosity for supported 140 Ni/Co/Pr (60:35:5) catalyst by various supports 5.16 Summary of type of hysteresis and shape of pores for 141 supported Ni/Co/Pr (60:35:5) catalyst by various supports 5.17 BET Surface area of blank support (without catalyst), and 141 supported catalyst before and after catalytic test 5.18 BET surface area of cordierite supported Ni/Co/Pr (60:35:5) catalyst with Ni/Pr (60:40) and Ni/Co (60:40) catalyst 143 xvii LIST OF FIGURES FIGURE NO. TITLE PAGE 1.1 Natural Gas Consumption by Region 1970-2025 2 1.2 Diagram of complete scrubber process 6 1.3 Diagram of basic membrane separation 7 2.1 Potential interactions of CO2 with MgO surface sites 16 3.1 Steps in adsorption of the catalyst 43 3.2 Schematic diagram of home built micro reactor 46 3.3 Packing arrangements of component in the sample tube 47 3.4 Schematic diagram of KBr window cell in the alignment 49 with the FTIR beam 3.5 X-rays scattered by atoms in an ordered lattice interfere 50 constructively in directions given by Braggs Law 3.6 Photoemission and the Auger process. Left: an incident X- 52 ray photon and a photoelectron emitted. 3.7 Block diagram of a photoelectron spectrometer 54 3.8 IUPAC Classifications of Gas Adsorption Isotherms 57 3.9 IUPAC Classification of hysteresis 58 4.1 Representative of the FTIR spectra for the CO2 decreasing 63 peak and formation of CH4 peak in the catalytic testing with the increase of temperature 4.2 Percentage of CO2 removal (line chart) and CH4 detected (bar chart) for Ni/Mg/Pr catalyst with the ratio of 60:10:30 and 60:30:10, and Ni/Mg 60:40 versus temperature from 25500 °C 64 xviii 4.3 Percentage of CO2 removal (line chart) and CH4 detected 66 (bar chart) for Ni/Zr/Pr catalyst with the ratio of 60:10:30 and 60:30:10, and Ni/Zr 60:40 versus temperature from 25500 °C 4.4 Percentage of CO2 removal (line chart) and CH4 detected 67 (bar chart) for Ni/Mo/Pr catalyst with the ratio of 60:10:30 and 60:30:10, and Ni/Mo 60:40 versus temperature from 25500 °C. 4.5 Percentage of CO2 removal (line chart) and CH4 detected 69 (bar chart) for Ni/Mn/Pr catalyst with the ratio of 60:10:30 and 60:30:10, and Ni/Mn 60:40 versus temperature from 25500 °C 4.6 Percentage of CO2 removal (line chart) and CH4 detected 70 (bar chart) for Ni/Co/Pr catalyst with the ratio of 60:10:30 and 60:30:10, and Ni/Co 60:40 versus temperature from 25500 °C. 4.7 Percentage of CO2 removal (line chart) and CH4 detected 71 (bar chart) for Ni/Fe/Pr catalyst with the ratio of 60:10:30 and 60:30:10, and Ni/Fe 60:40, versus temperature from 25500 °C 4.8 Percentage of CO2 removed (line chart) and CH4 detected 72 (bar chart) for Ni/Cu/Pr catalyst with the ratio of 60:10:30 and 60:30:10, and Ni/Cu 60:40, versus temperature from 25500 °C. 4.9 Comparison of CO2 removal and CH4 yield for Ni/M*/Pr 74 catalyst in the ratio of (a) 60:10:30 and (b) 60:30:10. (M=Mg, Zr, Mo, Mn, Co, Fe, and Cu) at the temperature of 350 °C 4.10 CO2 elimination for Ni/Co/Pr catalyst with various ratios of 75 Co at the temperature in the range of 30 to 500°C. 4.11 CO2 elimination for Ni/Co/Pr (60:35:5) and Ni/Pr (60:40) catalyst at the temperature in the range of 30 °C to 500°C 76 xix 4.12 The catalytic activity of powdered Ni/Co/Pr catalyst versus 77 number of catalytic testing 4.13 Diffractogram of unsupported Ni/Mg/Pr with ratio of (a) 79 60:10:30 and (b) 60:30:10 4.14 Diffractogram of unsupported Ni/Fe/Pr with ratio of (a) 81 60:10:30 and (b) 60:30:10 4.15 Diffractogram of unsupported Ni/Co/Pr with ratio of (a) 82 60:10:30 and (b) 60:30:10 4.16 Diffractograms of unsupported Ni/Co/Pr ratio 60:35:5 84 catalyst calcined at different temperatures; (a) 300°C, (b) 400°C, and (c) 800°C 4.17 SEM micrographs of unsupported Ni/Co/Pr catalyst in the 85 ratio of 60:35:5 (a) before and (b) after it was calcined at 400°C for 17 hours. (Magnification 1000x) 4.18 EDX of unsupported Ni/Co/Pr catalyst with ratio of 86 (60:35:5) 4.19 BET isotherm plot of unsupported Ni/Mg/Pr catalyst in the 88 ratio of 60:35:5 4.20 BET isotherm plot of unsupported Ni/Fe/Pr catalyst in the 89 ratio of 60:35:5. 4.21 BET isotherm plot of unsupported Ni/Co/Pr catalyst in the 89 ratio of 60:35:5 4.22 Spectra of unsupported Ni/M*/Pr (M* = Mg, Mo, Zr, Mn, 94 Co, Fe, Cu) in the ratio of 60:30:10 after calcined at 400°C before catalytic testing 4.23 Spectra of unsupported Ni/M*/Pr (M* = Mg, Mo, Zr, Mn, 95 Co, Fe, Cu) in the ratio of 60:30:10 after calcined at 400°C and after catalytic testing 5.1 Catalytic activity of various supported Ni/Co/Pr catalysts 97 with the ratio of 60:35:5 5.2 Catalytic activity of cordierite supported Ni/Co/Pr with various ratio of elemental composition (a) 60:35:5, (b) 50:45:5, (c) 47.5: 47.5: 5, and (d) 45:50:5 98 xx 5.3 Catalytic activity of cordierite supported Ni/Co/Pr with 99 various catalyst loading percentage of (a) 5%, (b) 25%, and (c) 50%. 5.4 Catalytic activity of cordierite supported catalyst with 101 different duration of dipping time; (a) 0.25hours, (b) 1hour, (c) 12 hours, (d) 24 hours, and (e) 48 hours 5.5 Catalytic activity of cordierite supported Ni/Co/Pr with 102 various calcination temperatures (a) 400 °C, (b) 600 °C, and (c) 800 °C for 10 hours 5.6 Catalytic activity of cordierite supported Ni/Co/Pr with 103 addition of (a) magnesium, and (b) zirconium as binder compared to cordierite supported Ni/Co/Pr catalyst 5.7 CO2 elimination for Ni/Co/Pr (60:35:5) and Ni/Pr (60:40) 104 catalyst supported by cordierite from the temperature of 25 to 500°C. 5.8 Catalytic activity of cordierite supported Ni/Co/Pr catalyst 105 versus number of catalytic tests 5.9 Catalytic activity of cordierite supported Ni/Co/Pr catalyst 106 that has been exposed to (a) CO and (b) H2S for 2 hours at 300 °C of temperature before the catalytic testing 5.10 Diffractogram of alumina bead supported Ni/Co/Pr (60:35:5) 108 catalyst 5.11 Diffractogram of molecular sieve of supported Ni/Co/Pr 109 (60:35:5) catalyst 5.12 Diffractograms of cordierite supported Ni/Co/Pr catalyst 111 (60:35:5) at different stages of catalytic testing; (a) before catalytic test, (b) after first catalytic test (intermediate), and (c) after third catalytic test 5.13 Diffractograms of cordierite supported Ni/Pr (60:40) catalyst 112 (a) before, and (b) after testing 5.14 Diffractograms of cordierite supported Ni/Co/Pr (60:35:5) catalyst with Zr as binder (a) before, and (b) after testing 113 xxi 5.15 XPS spectra of deconvoluted Ni (2p) for (a) unsupported 117 Ni/Co/Pr catalyst, (b) cordierite supported Ni/Co/Pr catalyst before catalytic testing, (c) cordierite supported Ni/Co/Pr catalyst after first catalytic testing, and (d) cordierite supported Ni/Co/Pr catalyst after third testing 5.16 XPS spectra of deconvoluted Co (2p) for (a) unsupported 119 Ni/Co/Pr catalyst, (b) cordierite supported Ni/Co/Pr catalyst before catalytic testing, (c) cordierite supported Ni/Co/Pr catalyst after first catalytic testing, and (d) cordierite supported Ni/Co/Pr catalyst after third testing 5.17 XPS spectra of deconvoluted Mg (2p) for (a) cordierite 122 support without catalyst, (b) cordierite supported Ni/Co/Pr catalyst before catalytic testing, (c) cordierite supported Ni/Co/Pr catalyst after first catalytic testing, and (d) cordierite supported Ni/Co/Pr catalyst after third testing 5.18 XPS spectra of deconvoluted Al (2p) for (a) cordierite 124 support without catalyst, (b) cordierite supported Ni/Co/Pr catalyst before catalytic testing, (c) cordierite supported Ni/Co/Pr catalyst after first catalytic testing, and (d) cordierite supported Ni/Co/Pr catalyst after third testing 5.19 XPS spectra of deconvoluted Si (2p) for (a) cordierite 126 support without catalyst, (b) cordierite supported Ni/Co/Pr catalyst before catalytic testing, (c) cordierite supported Ni/Co/Pr catalyst after first catalytic testing, and (d) cordierite supported Ni/Co/Pr catalyst after third testing 5.20 XPS spectra of deconvoluted O (1s) for (a) cordierite support 129 without catalyst, (b) cordierite supported Ni/Co/Pr catalyst before catalytic testing, (c) cordierite supported Ni/Co/Pr catalyst after first catalytic testing, and (d) cordierite supported Ni/Co/Pr catalyst after third testing 5.21 SEM micrographs of alumina bead supported Ni/Co/Pr catalyst in the ratio of 60:35:5 (a) before and (b) after it was calcined at 400°C for 17 hours. (1000x and 5000x) 132 xxii 5.22 SEM micrographs of molecular sieve supported Ni/Co/Pr 133 catalyst in the ratio of 60:35:5 (a) before and (b) after it was calcined at 400°C for 17 hours. (Magnification 1000x and 5000x) 5.23 SEM micrographs of cordierite supported Ni/Co/Pr catalyst 134 in the ratio of 60:35:5 (a) before and (b) after it was calcined at 400°C for 17 hours. (Magnification 1000x and 5000x) 5.24 EDX of alumina bead supported Ni/Co/Pr catalyst (60:35:5) 135 5.25 EDX of molecular sieve supported Ni/Co/Pr catalyst 136 (60:35:5) 5.26 EDX of cordierite supported Ni/Co/Pr catalyst (60:35:5) 137 5.27 BET isotherm plot of alumina supported Ni/Co/Pr catalyst in 139 the ratio of 60:35:5 5.28 BET isotherm plot of molecular sieve supported Ni/Co/Pr 140 catalyst in the ratio of 60:35:5 5.29 BET isotherm plot of cordierite supported Ni/Co/Pr catalyst 140 in the ratio of 60:35:5 5.30 FTIR spectrum of alumina bead supported Ni/Co/Pr 144 (60:35:5) catalyst 5.31 FTIR spectrum of molecular sieve supported Ni/Co/Pr 144 (60:35:5) catalyst 5.32 FTIR spectrum of cordierite supported Ni/Co/Pr (60:35:5) catalyst 145 xxiii LIST OF SYMBOLS AND ABBREVIATIONS BET - Brunnauer, Emmett and Teller Conv. - Conversion Cu Kα - X-ray diffraction from Copper K energy levels Rate of Conversion (percentage) d - Pore diameter DTA - Differential thermal analysis EDX Energy Dispersive X-Ray Analysis EDF - Equilibrium deposition filtration EIA - Energy Information Administration FTIR - Fourier Transformed Infra Red HC - Hydrocarbon IR - Infra red IUPAC - International Union of Pure and Applied Chemistry IWI - Incipient Wetness Impregnation NA - Nitrogen gas adsorption NG - Natural gas NOx - Nitrogen oxides OSC - Oxygen Storage Capacity P/Po - Relative pressure; obtained by forming the ratio of the equilibrium pressure and vapour pressure Po of the adsorbate at the temperature where the isotherm is measured PDF - Powder Diffraction File REO - Rare Earth Oxides RT - Room Temperature SEM - Scanning Electron Microscopy xxiv SMSI - Strong Metal-Support Interaction TG - Thermogravimetry TLO - Light-off Temperature Tmax - Maximum Conversion Temperature TOF - Turnover frequency (repeated tests) TWC - Three-way Catalyst w/w % - Weight per weight percentage ratio. XPS - X-ray Photoelectron Spectroscopy XRD - X-ray Diffraction θ - Half Angle of Diffracted Beam λ - wavelength ΔEso - Spinning orbital energy xxv LIST OF APPENDICES APPENDIX A TITLE Calculation of atomic weight percentage ratio of PAGE 178 element in catalyst preparation B Calculation of the percentage for CO2 removal and 175 CH4 yield from catalytic testing C d-spacing values from XRD analysis of unsupported 178 and supported catalyst D Figures of supported catalyst with different metal loadings 184
