AHP Evaluation for Improving Transport Choice in Phnom Penh City Virakvichetra LON
advertisement
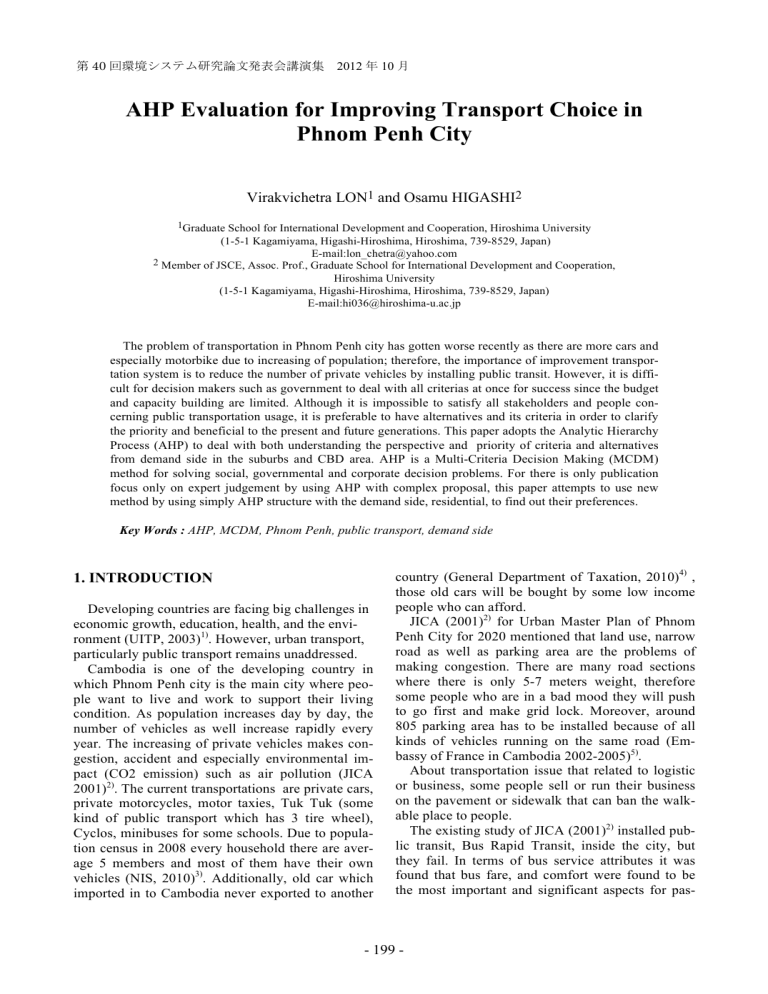
第 40 回環境システム研究論文発表会講演集 2012 年 10 月 AHP Evaluation for Improving Transport Choice in Phnom Penh City Virakvichetra LON1 and Osamu HIGASHI2 1Graduate School for International Development and Cooperation, Hiroshima University (1-5-1 Kagamiyama, Higashi-Hiroshima, Hiroshima, 739-8529, Japan) E-mail:lon_chetra@yahoo.com 2 Member of JSCE, Assoc. Prof., Graduate School for International Development and Cooperation, Hiroshima University (1-5-1 Kagamiyama, Higashi-Hiroshima, Hiroshima, 739-8529, Japan) E-mail:hi036@hiroshima-u.ac.jp The problem of transportation in Phnom Penh city has gotten worse recently as there are more cars and especially motorbike due to increasing of population; therefore, the importance of improvement transportation system is to reduce the number of private vehicles by installing public transit. However, it is difficult for decision makers such as government to deal with all criterias at once for success since the budget and capacity building are limited. Although it is impossible to satisfy all stakeholders and people concerning public transportation usage, it is preferable to have alternatives and its criteria in order to clarify the priority and beneficial to the present and future generations. This paper adopts the Analytic Hierarchy Process (AHP) to deal with both understanding the perspective and priority of criteria and alternatives from demand side in the suburbs and CBD area. AHP is a Multi-Criteria Decision Making (MCDM) method for solving social, governmental and corporate decision problems. For there is only publication focus only on expert judgement by using AHP with complex proposal, this paper attempts to use new method by using simply AHP structure with the demand side, residential, to find out their preferences. Key Words : AHP, MCDM, Phnom Penh, public transport, demand side country (General Department of Taxation, 2010)4) , those old cars will be bought by some low income people who can afford. JICA (2001)2) for Urban Master Plan of Phnom Penh City for 2020 mentioned that land use, narrow road as well as parking area are the problems of making congestion. There are many road sections where there is only 5-7 meters weight, therefore some people who are in a bad mood they will push to go first and make grid lock. Moreover, around 805 parking area has to be installed because of all kinds of vehicles running on the same road (Embassy of France in Cambodia 2002-2005)5). About transportation issue that related to logistic or business, some people sell or run their business on the pavement or sidewalk that can ban the walkable place to people. The existing study of JICA (2001)2) installed public transit, Bus Rapid Transit, inside the city, but they fail. In terms of bus service attributes it was found that bus fare, and comfort were found to be the most important and significant aspects for pas- 1. INTRODUCTION Developing countries are facing big challenges in economic growth, education, health, and the environment (UITP, 2003)1). However, urban transport, particularly public transport remains unaddressed. Cambodia is one of the developing country in which Phnom Penh city is the main city where people want to live and work to support their living condition. As population increases day by day, the number of vehicles as well increase rapidly every year. The increasing of private vehicles makes congestion, accident and especially environmental impact (CO2 emission) such as air pollution (JICA 2001)2). The current transportations are private cars, private motorcycles, motor taxies, Tuk Tuk (some kind of public transport which has 3 tire wheel), Cyclos, minibuses for some schools. Due to population census in 2008 every household there are average 5 members and most of them have their own vehicles (NIS, 2010)3). Additionally, old car which imported in to Cambodia never exported to another 1 -- 199 199 - (2) Sampling The author randomly selected participants in each suburb location along the highway and about three hundred meters from the access road. On the other hand, all participants in four central districts were selected along Main Street. Moreover, in central district the author purposely selected only public worker, as well as students from one of the famous private University called Build Bright University because there are a lot of students use their private car access to the University. The author used total sampling of 500 participants. It means that he chose 40 participants in each thirteen location, nine locations from suburban and four from the central district. In one condition one location was selected only twenty respondents due to their knowledge and the number of people in that area were small as well as the author took the other 20 samples as the Pilot survey. Table 1 shows about participants selected and district with the number of participants, and location code and type. sengers in Phnom Penh (Kasem CHOOCHARUKUL and, Meng Hong UNG 2011)6). As the budget for developing public transit is low, ranking and understanding of the priority of the criteria for people, Analytic Hierarchy Process ( AHP) is employed in this paper in order to give a clear opinion to decision makers to choose the most priority to develop for attracting riders for public transport. 2. METHODOLOGY (1) Data collection Phnom Penh is a capital city of Cambodia in which has 678.46 km2 (0.37% of Cambodia), with Population 1.327,615 million in present time with a density of 4,571.1 p/Km2 (NIS, July 2010)3). There are eight districts (Khans) in the city, in which there are four main districts in the central. Fig.1 is the map of all districts in Phnom Penh city and the red circles are the survey area selected. Each commune in the four outsider district was selected based on randomly selecting. As the four central districts are the CBD (Central Business District), researcher, he chose 12 Km from CBD for five locations and 6 Km from CBD for four locations as in the Fig.1. Table 1 Distribution of questionnaire to each zone code Zone Code 1203 1201 08 03 District Name 7 Makhara Chamkar Morn 1202 Donpenh 1204 Tuol Kork 04 03 40 40 40 Chaom Chao Suburb 40 Plerng Chhesroteh Suburb 20 120501 Dangkor Suburb 40 120607 Chak Angrae Kraom Suburb 40 Nirouth Suburb 40 120608 07 40 40 Dangkor 120504 01 04 City center City center City center City center Peo -ple Suburb 120505 05 Location Type Samraong Kroam 120509 09 Location Name Mean Chey 120803 Sensok Khmuonh Suburb 40 120704 Ruessei Koe Kilometre 6 Suburb 40 Prek lieb Suburb 40 120708 TOTAL 500 (3) Research instrument AHP was found by Thomas Saaty7) in the late 1980s. Of course there were two parts of the instrument for this survey, one was about So- Fig.1 Survey administrative areas in Phnom Penh city 2 -- 200 200 - cial-economic characteristic asking about the respondents’ locations, age, gender .Etc, as shown in Appendix A-1. The other part was AHP questionnaire survey in Appendix A-2. In order to develop the questionnaire AHP structure was produced using step 1 of the 4 steps ( Johnson 1980)8). In Fig.2 shown the setting up the decision hierarchy by breaking down the dilemmas of the decision into three levels of interrelated decision elements (Satty 1977a, 1977b, 1977c, 1977d, 1978b, 1980)9). Level one was the Goal, level two were the Criteria and the last one was the Alternatives of transportation choice. Needless to say, there is no intra-city bus in Phnom Penh city therefore Information criteria was not reliable to the participant for an answer. According to the literature of interviewing transportation users as well as the existing study in 2011 by Kasem CHOOCHARUKUL and Meng Hong 6), the author had selected the criteria, Cost, Inside environment, Waiting time, Time travel and Safety for level 2. On the other hand existing transportations Car and Motorbike were selected as the two alternatives in Level 3. In the reason of this, most people in Phnom Penh city are using private cars and motorbike as the priority for travel. Base on MPWT12) (2010), the registered of motor bike increased to 236, 614 and cars 24, 355. What is more, the author carefully had chosen two predictions of public transport, BUS and Light Rail. The public transport which appropriate for using in Phnom Penh city bus on distance, pricing, road width, infrastructure and speed, both Bus and Light Rail was introduced to be the next public transport in Phnom Penh city (SYSTRA) 13). The AHP pairwise comparison of each criteria and alternative, was complicated and misunderstanding easily, so the author spent one day to finish for one location. Due to this reason, before conducting a survey the researcher had gathered all assistants for explanation about all parts of the survey content till they understand well. According to Satty (1995)14), making group discussion is better to rely on the single decision maker or respondents as brainstorming and idea sharing to improve the accuracy of the final result and reduce bias. Though he gathered people in a group in suburb, in urban and CBD were difficult to do so. Consequently, the author interviewed the respondents one by one in order not to misfiling the questionnaire. In AHP questionnaire comparisons, the author and assistances asked participants to compare between each criterion by giving a score from 1 to 9 in Table 2, as well as the alternative. The judgement from individual participants are then synthesized into a single judgement through geometric means in order to get an overall result of the priorities for each criterion in every level of hierarchy. The geometric mean for synthesizing individual judgments is shown in equation 1 and 2. Travel cost Transportation choice Light rail Waiting time Bus rapid Travel time Motorcycle Comfort Private car Travel safety Fig.2 AHP structure decision model for transportation choice. At level two there were five criteria selected, Cost, inside environment, Waiting time, Travel time and Safety. Selecting this criteria base on Kasem CHOOCHARUKUL and Meng Hong UNG6) in 2011, they have conducted survey system using State Preference by using this criteria, Fare, Waiting time, Heading time and Bus comfort in Phnom Penh city. Moreover, J.W. Guiver10) (2007) used Modal talk, discourse analysis, of how people talk about bus and car travel; found that most of people cared about Cost, Timing (Waiting time and travel time), Comfort and information. In addition, J. Hine and J. Scott11) (2000) in Scotland, by suing in-depth interview of public transport to non-users, car users and taxi found that the interchange and the public transport could become more attractive to all users depended on Accurate information, Walking distance, Waiting time, Cost of public transport and Safety. (1a) Thus, (1b) Where G = Geometric mean, a = Pairwise comparison scale given by an expert, n = Number of respondents 3 -- 201 201 - to it. This represents the contribution of category to the overall goal. The local eigen values are also shown as in Table 3 Matrix 1 and Table 4 Matrix 2 till 6 for alternative pairwise respect to each criterian. The Safety attributes leads all others, with Travel Time, Comfort and Waiting Time attribute next. Noticeable, Cost factor lags further behind. This ranking, which emerged from our pairwise comparison analysis, seems reasonable given observations on the current situation in Phnom Penh city as traffic accidents occurred everyday as well as traffic congestion. Several important observations can be made regarding the results of people’s preference scenario. These are the following: 1. In case of Travel Cost (7.0%), Motorcycle is the dominant alternative affecting approximately 51% of the score followed by BRT (23.7%), LRT (16.8%) and the last is Car (8.8%), see Table 4, Matrix 2. This implies that there will be less use of Car, but not Motorcycle if the Travel Cost is high. 2. Moreover, Motorcycle gets the highest score of 36.8 % and this time Car is preferred almost the same as the Motorcycle of 34.7% higher than Public Transportation BRT (13.4%) and LRT (15.2%) in Waiting Time criteria, shown in Table 4, Matix 3, since Public Transport contains waiting time for 10 minutes . What is more in Table 4, Matrix 5 of Travel Time (15.9%), private vehicles Motorcycle (35.2%) and Car (32.3%) has led the two public transports BRT (20.8%) and LRT (11.7%). Considering about the flexibility of travel mode private vehicles still dominant to public transportation, but LRT is preferred due to Travel Time with segregated way for the tramway. 3. However, Motorcycle is less preferred in Safety and Comfort criteria and the most safety preferred is alternative Car followed by LRT and BRT, see Table 4, Matrix 4 and 6. Therefore, to overcome the Safety and Comfort is to increase rider-ship of Public Transportation as reducing Motorcycle. Table 2 9-point scale for pairwise comparisons in AHP Intensity of Importance Definition 1 Equal importance 3 Moderate importance 5 Essential or strong importance 7 Very strong importance 9 Extreme importance Immediate values between above scale values Source: Saaty1980 2,,5,6,8 Explanation Two criteria/ sub-criteria contribute equally to the level above Judgment slightly favors on criterion/ sub-criterion over another Judgment strongly favors on criterion/ sub-criterion over another A factor is strongly favored and its dominance demonstrated in practice The evidence of favoring one factor over another is of the highest possible order of affirmation Absolute judgment cannot be given and a compromise is required 3. RESULT OF PRIORITY WEIGHTS (1) Current scenario Expert choice 15) was applied in order to synthesize AHP comparison of each level in both local and global. As stated above, this scenario represents what we believe will be the result of people’s preference at the time of conducting the survey and study. Table 5 identifies each of the criteria or the factor of the AHP tree in rows and the transportation alternatives in columns in Overall of the total sampling. In addition in row C.R. (Consistency Ratio) shows the value of consistency of pairwise matrix score and it has to be less than 0.10 (C.R.<0.10) as well as λmax is the maximum eigen value and λmax >n (n is the number of eigenvalue). The alternative with the highest score is considered ‘‘best.’’ In this case, the first alternative is Car (40.3%), followed by Light Rail Transit (21.1%), and closely followed by Motorcycle (20.1%) and Bus Rapid Transit (18.5%) is the least preferred option. Before engaging in a discussion of these results, it is instructive to review Table 5 more closely. Each criteria category in the table has an associated percentage next Table 3 Comparisons of five criteria, effect to transport choice. Matrix 1: Criteria with respect to the goal TC WT Com TT Saf TC 1 1/1.45 1/1.59 1/2.33 1/6.65 WT 1 1/1.24 1/2.26 1/5.65 Com 1 1/1.61 1/5.63 TT 1 1/5.03 Saf 1 Consistency Ratio EV 0.07 0.08 0.10 0.15 0.57 0.01 Note: TC = Travel Time; WT = Waiting Time; Com = Comfort; TT = Trave Time; Saf = Safety; EV Eigenvector 4 -- 202 202 - (1) Cost scenario In this scenario, we adjusted the Travel Cost first-level attribute to be the dominant attribute (comprising approximately 77% of the total weight of the decision). Other first-level attributes were reduced proportionately by Expert Choice15) 11. Although the weight placed on cost under this scenario may seem extreme at first, it allows us to test the robustness of the final results. One could just as easily craft a scenario in which Travel Cost was weighted less importantly. Fig.3 shows the overall results. Table 4 Comparisons of alternatives respect to each criteria Matrix 2: Alternative with respect to Criteria TC Car Mot BRT LRT EV Car 1 1/4.56 1/3.29 1/2.03 0.088 Mot 1 2.69 3.01 0.508 BRT 1 1.44 0.237 LRT 1 0.168 Consistency Ratio 0.01 Note: Mot = Motor Bike; BRT = Bus Rapid Transit; LRT = Light Rail Transit Matrix 3: Alternative with respect to Criteria WT Car Mot BRT LRT EV Car 1 1/1.07 2.63 2.39 0.347 Mot 1 2.63 2.51 0.368 BRT 1 1/1.17 0.134 LRT 1 0.152 Consistency Ratio 0.00 Matrix 4: Alternative with respect to Criteria Com Car Mot BRT LRT EV Car 1 2.92 1.67 2.14 0.418 Mot 1 1/1.43 1/1.25 0.154 BRT 1 1.18 0.233 LRT 1 0.195 Consistency Ratio 0.00 Matrix 5: Alternative with respect to Criteria TT Car Mot BRT LRT EV Car 1 1.01 2.22 1.76 0.323 Mot 1 3.11 1.85 0.352 BRT 1 2.20 0.117 LRT 1 0.208 Consistency Ratio 0.01 Matrix 6: Alternative with respect to Criteria Saf Car Mot BRT LRT EV Car 1 3.88 2.43 2.29 0.469 Mot 1 1/1.83 1/2.48 0.105 BRT 1 1/1.09 0.197 LRT 1 0.229 Consistency Ratio 0.00 Fig.3 Interaction of alternatives while increase TC to 77.5% Transportation alternatives that are penalized by a higher weighting of Travel Cost factors include Car bike and Light Rail Transit. What is important is alternative Motorbike is the highest before Bus Rapid Transit. This is primarily due to the higher costs for travel to the CBD or other destination including, fuel cost, maintenance, parking. Motorbike is ahead of 43.4% and BRT two dominant alternatives under Travel Cost-driven scenario. Table 5 Overal result of alternatives respect to the Goal Goal: Transportation Choice, Unit % Car Mot BRT Overall EV 40.3 20.1 18.5 TC 7.0 8.8 50.8 23.7 WT 8.8 34.7 36.8 13.4 Com 10.5 41.8 15.4 23.3 TT 15.9 32.3 35.2 11.7 Saf 57.8 46.9 10.5 19.7 LRT 21.1 16.8 15.2 19.5 20.8 22.9 5 -- 203 203 - vate vehicles. Though the overall result of the evaluation in a previous section revealed that LRT was selected in the second raking car and motorcycle are still most wanted for commuting because of the time factor. Safety is the criterion that is the most significant for people when they travel. However, this criterion is negative significance of choosing public transport. It means that if safety is secured in the city, people will change their attitude to use motor bike more than other alternatives. The reason is that people chose public transport because of safety travel, mostly based on accident and robbery. In contrast, if the safety is low for public transport people will choose a motorbike instead. Moreover, Travel cost is the lowest consideration in the AHP evaluation. However, in Fig.3 shown that if the travel cost is moving up, of course, Motorbike is number one, but the car is the last choice due to fuel consumption and maintenance. The other finding due to overall result is level of service, Time and Comfort is very important to promote public transport. In addition to the cost or fear of public transport is fair if the level of service was reliable (J. Hine, J. Scott, 2000)11). In conclusion of AHP evaluation, level of service is more important than travel cost as in this case level of service including, safety, travel time, waiting time and comfort. Therefore, it is important to stable the safety of traveling follow by decrease travel time, comfort (air conditioning, good condition chair and noiseless) and last but not least waiting time must be accurate. (2) Time scenario In the third scenario, we increased the relative weights given to the Time first-level attributes include Waiting Time and Travel Time. As shown in Fig.4, Waiting Time and Travel time attribute now compose 33% each of the decision weighting under this scenario. Here, again LRT and BRT are penalized due to waiting and headed time problems as we compare the first scenario above. Indeed, from Time value point of view, BRT and LRT would offer little improvement over the Waiting Time and Travel time we see today. Instead, private vehicles would define the future transportation landscape. ACKNOWLEDGMENT: This research was supported by Strategic Funds for the Promotion of Science and Technology, Global Environmental Leaders Educational Program for Designing a Low-Carbon World, Hiroshima University. REFERENCES 1) Fig.4 Interaction of alternatives while increase WT and TT to around 33% 2) 4. CONCLUSION 3) This paper revealed the importance of understanding users' attitude related to factors or criteria and accounting for their bearing on transportation choice both private and public transportation. The finding that related to this objective is that, there is no way to change people’s perception in using pri- 4) 5) 6 -- 204 204 - UITP, Better Urban Mobility in Developing Countries, http://www.uitp.org/publications/brochures/Dev-Countries -uk.pdf, December 2003. JICA, Final Report of The study on the pransport master plan of the Phnom Penh metropolitan area in the Kingdom of Cambodia, Municipality of Phnom Penh Kingdom of Cambodia, 2001. National Institute of Statistics, General Population Census of Cambodia 2008“ Village Indicators Part1”. Ministry of planning Phnom Penh, Cambodia, July 2010. General Department of Taxation, Major export and import 2004-2010, Costoms and Excise Department, Phnom Penh Cambodia, 2010. Embassy of France in Cambodia, FSP Support for the project on the management of the urban management and development in Cambodia. Bureau ofUrban Affairs, Munici- pality of Phnom Penh, 2002-2005 Choocharukul, K. and M. H. UNG, “Propensity to Switch to a New Bus Service in Phnom Penh using Stated Preference Analysis,” Asian Transport Studies, Vol. 1, Issue 3, pp. 277-287, 2011. 7) Saaty TL The Analytic Hierarchy Process. NY, McGraw Hill, 1980. 8) Johnson, C.R. “Constructive critique of a hierarchical prioritization scheme employing paired comparisons,” Proceedings of the International Conference of Cybernetics and Society of the IEEE, Institue of Electrical Engineers, Cambridge, Massachusetts, pp.373-378, 1980. 9) Saaty TL A scaling method for priorities in hierarchica structures. Journal of Mathematical Psychology 15:234-281, 1977. 10) J W Guiver, Modal talk: Discourse analysis of how people talk about bus and car travel. Transportation Research Part A: Policy and Practice 41 (3) p. 233-248, 2007. 11) J Hine, J Scott, Seamless, accessible travel: users' views of the public transport journey and interchange, Transport Policy 7 (3) p. 217-226, 2000. 12) Ministry of Public Works and Transport, Statistic of Vehicles 2000-2010, 2010. 13) SYSTRA, Phase 2 – Public Transport Network Scheme Proposal and Priority Line's Definition, Municipality of Phnom Penh Kingdom of Cambodia, 2012. 14) Saaty, T. L. Decision Making for leaders: Planning, priority setting, resource allocation. McGraw-hill, New York,1995. 15) Expert Choice, Decision Support Software. Inc. McLean VA, 1993/8. 6) (Received July 18, 2012) 7 -- 205 205 -
