SITE SPECIFIC ASSESSMENT OF CLIMATE CHANGE IMPACTS ON GROUNDWATER TEMPERATURE
advertisement
土木学会東北支部技術研究発表会(平成20年度)
II-28
SITE SPECIFIC ASSESSMENT OF CLIMATE CHANGE IMPACTS ON
GROUNDWATER TEMPERATURE
Tohoku University Graduate Student O Luminda GUNAWARDHANA
Tohoku University Fellow Member So KAZAMA
2. THEORY
The governing equation for heat transport in one
dimensional homogeneous porous media
α ∂ 2T ∂z 2 − β(∂T ∂z ) = ∂T ∂t ,
(1)
where T is temperature; z is the depth from the ground
surface; t is time, α (= k/cρ) is the thermal diffusivity of
the aquifer; and β = vc0ρ0/cρ where v is the vertical
groundwater flux (positive downward), c0ρ0 is the heat
capacity of the water, and cρ is the heat capacity of the
porous medium. The initial boundary conditions,
considering a linear increase in ground surface
temperature, can be written as,
T( z ,0 ) = T0 + az
(2)
(
)
T(0 ,t ) = T0 + bt ,
(3)
where T0 is the ground surface temperature at t = 0, a
is the general thermal gradient, and b is the rate of
surface warming. Under the above initial boundary
conditions, Carslaw et al. 1959 obtained an analytical
solution for the temperature distribution as a function
of depth and time;
T = T0 + a ( z − β t ) + {(b + β a ) / 2β} × [( z + β t ) exp(β z / α )
temperatures were measured. The transfer function
method was used to downscale the coarse resolution
temperature and precipitation from the GCM grid box
to the Sendai metrological station. The regression
relationships are calibrated using parallel time series of
GCM output and local scale observations for the period
of 1967-2006 for corresponding variable. Those
transfer functions were then used to downscale the
1927-1966 GCM data to the Sendai plain and later
verified with the observed precipitation. For climate
prediction, those transfer functions were further used to
downscale 2060-2099 GCM variables.
Observed temperature-depth profiles were first used
to estimate the groundwater recharge in the Sendai
plain. These results were validated using the observed
water levels. Moreover, water budget technique was
applied and representative parameters were adjusted to
cope with site conditions which gives reasonably match
groundwater recharge value as estimated from the
temperature-depth
profiles.
Later,
downscale
temperature and precipitation were used to estimate the
ground surface temperature change and recharge
variations in future. Finally, these changes were applied
in the Equation 4 to estimate the potential groundwater
temperature changes.
4. RESULTS AND DISCUSSION
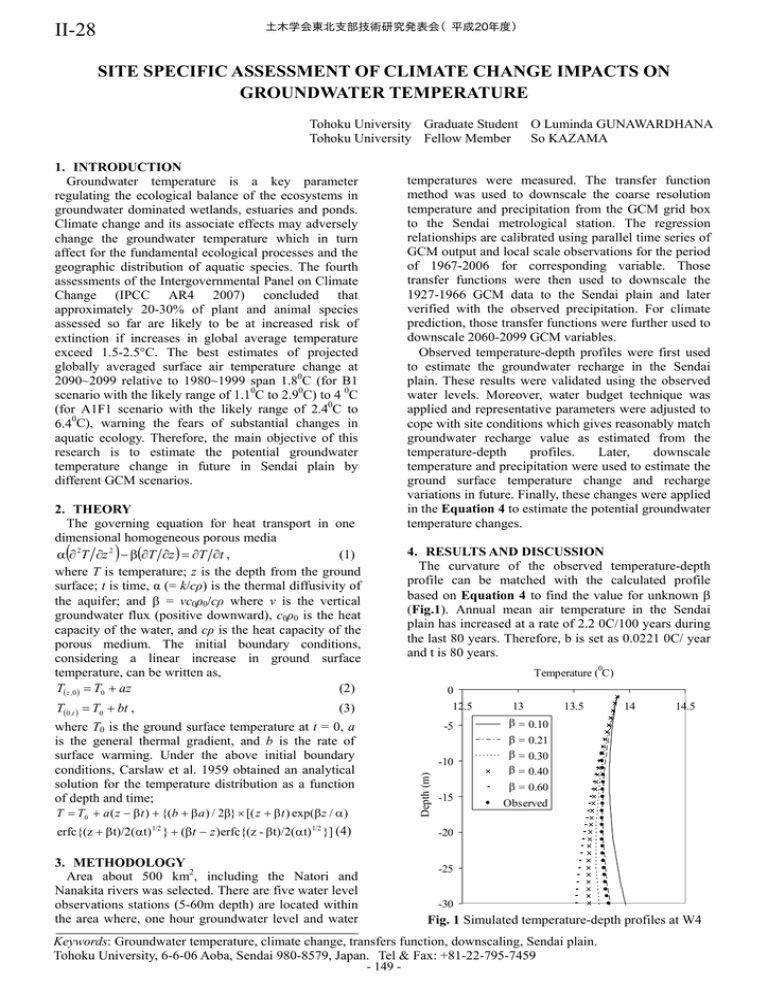
The curvature of the observed temperature-depth
profile can be matched with the calculated profile
based on Equation 4 to find the value for unknown β
(Fig.1). Annual mean air temperature in the Sendai
plain has increased at a rate of 2.2 0C/100 years during
the last 80 years. Therefore, b is set as 0.0221 0C/ year
and t is 80 years.
0
Temperature ( C)
0
12.5
-5
-10
Depth (m)
1. INTRODUCTION
Groundwater temperature is a key parameter
regulating the ecological balance of the ecosystems in
groundwater dominated wetlands, estuaries and ponds.
Climate change and its associate effects may adversely
change the groundwater temperature which in turn
affect for the fundamental ecological processes and the
geographic distribution of aquatic species. The fourth
assessments of the Intergovernmental Panel on Climate
Change (IPCC AR4 2007) concluded that
approximately 20-30% of plant and animal species
assessed so far are likely to be at increased risk of
extinction if increases in global average temperature
exceed 1.5-2.5°C. The best estimates of projected
globally averaged surface air temperature change at
2090~2099 relative to 1980~1999 span 1.80C (for B1
scenario with the likely range of 1.10C to 2.90C) to 4 0C
(for A1F1 scenario with the likely range of 2.40C to
6.40C), warning the fears of substantial changes in
aquatic ecology. Therefore, the main objective of this
research is to estimate the potential groundwater
temperature change in future in Sendai plain by
different GCM scenarios.
-15
erfc{(z + β t)/2(αt) 1/2 } + (β t − z )erfc{(z - β t)/2(αt) 1/2 }] (4)
-20
3. METHODOLOGY
Area about 500 km2, including the Natori and
Nanakita rivers was selected. There are five water level
observations stations (5-60m depth) are located within
the area where, one hour groundwater level and water
-25
13
13.5
14
14.5
β = 0.10
β = 0.21
β = 0.30
β = 0.40
β = 0.60
Observed
-30
Fig. 1 Simulated temperature-depth profiles at W4
Keywords: Groundwater temperature, climate change, transfers function, downscaling, Sendai plain.
Tohoku University, 6-6-06 Aoba, Sendai 980-8579, Japan. Tel & Fax: +81-22-795-7459
- 149 -
土木学会東北支部技術研究発表会(平成20年度)
b)
30
30
1967-2006
Observed monthly temperature ( C)
25
0
0
Observed monthly temperature ( C)
a)
20
Jan
Feb
Mar
App
May
Jun
5
Jul
Aug
0
Sep
Oct
Nov
Dec
15
10
1927-1966
25
20
15
10
-5
5
0
Jan
Feb
Mar
App
May
Jun
Jul
Aug
Sep
Oct
Nov
Dec
-5
-5
0
5
10
15
20
25
0
Downscaled GCM monthly temperature ( C)
30
-5
0
5
10
15
20
25
Downscaled GCM monthly temperature (0C)
30
Fig. 2 qq-plots of observed vs. downscaled temperature for HADCM3 A2 scenario
HADCM3 projected increasing trend of precipitation
for the 2060-2099 time periods than the annual
average of past 40 years (1967-2006). A2 scenario
produces the highest annual precipitation rise (345
mm; about 28% change from past 40 year’s average)
followed by A1B (210mm) and B1 (87mm). To
account the climate change impacts, the estimated
changes were compared with the present climate and
results are shown in Table 1.
We calculated the recharge rates from the obtained β
values (β = vc0ρ0/cρ) to be 100 mm/year at W1, 135
mm/year at W2, 120 mm/year at W3, 125 mm/year at
W4, and 90 mm/year at W5. In order to estimate the
representative recharge rate for the whole catchment,
the Thiessen polygon method was applied. The
approximate annual recharge rate in the Sendai plain
was estimated to be 120 mm. This value is reasonably
matched with the recharge rate estimated from the
water budget technique (135 mm/year). Based on the
observed water level records, 0.08 m/m, 0.17 m/m and
0.15 m/m of hydraulic gradients were estimated in the
W1, W2 and W4 respectively for shallow sub surface
layer. According to the Darcy’s low, high hydraulic
gradient (HG) produces large water flow and therefore,
estimated HGs further verify the slight changes of
recharge values estimated from the T-D profiles.
The determination coefficient (r2) of the linear and
non-linear regressions was considered for the
appropriate transfer functions selection. Both linear and
non-linear functions were used such a way that the r2 of
the corresponding transfer function is always above
0.9. The downscaled temperature values for HADCM3
A2 scenario were plotted with observed temperature in
Fig. 2 for all months of the year, illustrating how well
the selected transfer functions reproduce the
temperature values to the Sendai station. Unlike
temperature, sea level patterns govern the local
variability in precipitation. Therefore, fitting a linear or
a simple non-linear transfer function for precipitation is
rather difficult for the precipitation than the
temperature. Thus, compare with the temperature,
downscaling results for precipitation show lesser
agreement with the observed records. Verified results
during 1927-1966 indicate several significantly
deviated points from the 1:1 line suggesting a poor
match for August and September, while the other
months show reasonably good agreement for the
predictions. However, in general all scenarios show
comparatively good results for precipitation that can be
used for long term impact predictions.
Compare with the time period of 1967-2006, A2
scenario gives the highest temperature rise in future
(3.90C) followed by A1B and B2 scenarios (3.80C and
2.50C, respectively). Similar to surface warming,
Table 1 Groundwater temperature change in future
Temperature rise (0C)
Scenario
Ground surface
Groundwater
A2
3.9
3.2
A1B
3.8
3.1
B1
2.5
1.7
If continue the
2.2
1
present trend
5. CONCLUSIONS
In this study, potential impacts of climate change on
groundwater temperature were estimated. Recharge rate,
estimated from the T-D profiles (average 120 mm/year)
reasonably match with the one estimated from the water
budget method. HADCM3 monthly data were
downscaled to the local scale. A2 scenario shows the
most robust effect than the other two scenario which
produces 3.20C groundwater temperature change in
future. These results will be significance for the
ecological balance of the eco-system and decision
makers can make more resilient decisions by
incorporating these results in their considerations.
ACKOWNLEGEMENTS
This work was supported by the Global Environment
Research Fund (S-4) of the Ministry of Environment,
Japan.
REFERENCES
IPCC (Intergovernmental Panel on Climate Change),
working group ΙΙ 2007: Impacts, Adaptation and
Vulnerability. Cambridge University Press.
Carslaw et al. 1959: Conduction of heat in solids,
2nd ed. Oxford university press, 1959.
- 150 -

